
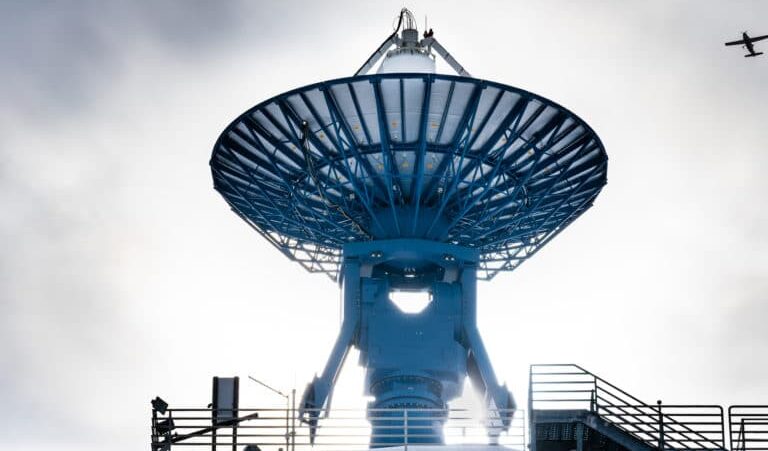
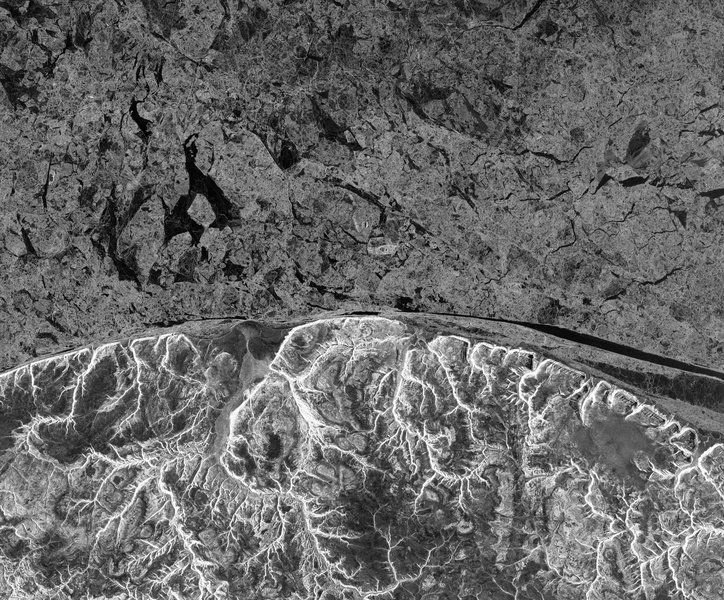
Northwest Passage sea ice contrasts with the coast of Baffin Island, Canada, in this ALOS-PALSAR image taken 8 March 2011. © JAXA, METI 2011
by Martin O. Jeffries
The first radar images that I ever saw were those in a publication that is, or should be, familiar to anyone associated with ASF – Seasat Views Oceans and Sea Ice with Synthetic Aperture Radar by Lee-Leung Fu and Ben Holt. I ordered a copy soon after its publication in February 1982 when I read that it contained images of ice island (tabular iceberg) T-3, sometimes known as Fletcher’s Ice Island.
I was interested in T-3 because, roughly 40 years earlier, it had calved from the once extensive Ellesmere Ice Shelf along the northernmost coast of Ellesmere Island, then in the Northwest Territories, now Nunavut, Canada. By 1982, disintegration and further ice island calvings had reduced the Ellesmere Ice Shelf to a number of smaller ice shelves. I first saw some of those ice shelves in April and May 1982, when I completed my first field season of doctoral research on ice shelf formation and structure.
After seeing T-3 in Fu and Holt (1982) and completing a second field season on the Ellesmere ice shelves in April and May 1983, I saw radar images of the ice shelves for the first time in November 1983 at the Canadian Ice Service (then known as the Ice Centre) in Ottawa. I had heard rumours that occasionally, budget permitting, the Ice Centre would include the northernmost coast of Ellesmere Island in round-robin flights that were obtaining real aperture radar (RAR, also known as side-looking airborne radar – SLAR) images of the Queen Elizabeth Islands. The budget gods must have been feeling generous in 1981 and 1983, because, when I visited the ice centre in November 1983, I saw the ice shelves in X-band (l = 32.5 mm) RAR images that had been obtained in September 1981 and April 1983.
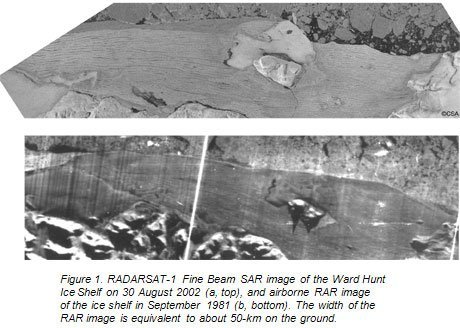
The images were not the radiometrically-calibrated, high-spatial-resolution SAR images (e.g., Figure 1a) that we take for granted today after raw signal data have been received, archived, processed and distributed by ASF. No, those SLAR images (e.g., Figure 1b) were low resolution (~200 m) photographs with bright, near-vertical slashes to mark time (and thus provide a scale if the air speed had been recorded), heavy shadows (due to the low flight altitude and thus low incidence angle), and numerous artifacts due to aircraft motion and processing factors. Nevertheless, it was a revelation for me to have this active microwave view of the ice shelves sandwiched between the land and the pack ice of the Arctic Ocean (Figure 1b).
I still have the 1981 and 1983 SLAR photographs of the Ellesmere ice shelves. They remind me of many things, including the fact that it was once possible to order photographic products (paper and transparency) from ASF. They have long since ceased to be available. Everything is digital now, with products delivered on a choice of tape, CD or DVD, or delivered direct to your desktop computer via ftp. Moreover, a variety of freely available computer tools developed by ASF make it easier for the user to be productive once they have their digital SAR data.
Product delivery typically takes a few days, but under some circumstances, ASF will deliver much more quickly.
For example, I enjoyed outstanding service in early August 2002, when Derek Mueller (then a graduate student at Université Laval, Québec, and now a NSERC Post-doctoral Fellow at the Geophysical Institute, UAF) reported from the Ward Hunt Ice Shelf that he had found many long, wide fractures in the ice. Thanks to ASF, I had RADARSAT-1 standard beam images on my computer less than 24 hours after I had placed the order and was able to confirm many of Derek’s observations. ASF then expedited a RADARSAT-1 fine beam data acquisition request for late August that not only showed the fractures in greater detail, but also confirmed the calving of more ice islands (Mueller, et al., 2003).
The ASF archive now contains a large volume of RADARSAT-1 data of northernmost Ellesmere Island. On the other hand, the archive contains very little ERS SAR data of the region. This is primarily a function of the reluctance of ESA to use ASF for data acquisition over a region that lies at the extreme northern edge of the ASF station mask for the ERS satellites. ASF personnel expended a lot of time and energy on my behalf trying to convince ESA that the ERS satellites could simultaneously illuminate the ice shelves and transmit the data to ASF. Although ESA eventually agreed to what turned out to be a successful demonstration of ASF’s argument that it could be done, ESA preferred to continue to use Tromsø for receiving data from the northernmost Ellesmere Island.
SAR data received at other ground stations are available to ASF users, but they cost real money, unlike the hundreds, perhaps thousands, of images I have “bought” from ASF with data credits. Like the majority of ASF users, I have benefited from an enlightened and generous NASA data policy based on its agreements with ESA, CSA, and JAXA. This policy has placed large numbers of images in researchers’ hands and allowed them to pursue exciting, and often ground-breaking, investigations with minimal anxiety about the financial costs. Rationing remote sensing data by charging high prices surely hinders scientific progress. ERS-1 and ERS-2, JERS-1 and RADARSAT-1 images would not reach the researchers without the skill of an ASF staff that is dedicated to receiving, archiving, processing and distributing high quality data in a timely fashion. There have always been such dedicated people at ASF, but there was a time when the complex ASF electronics and electrical engineering systems were viewed by some as an end in themselves rather than a means to a more vital end — getting data into the hands of users so they could apply their talents to answering interesting and important questions.
For a short time in the early to mid-1990s, I found myself in the unexpected position of being a “super user” of ASF data. That is, my name was on all the orders being placed, mainly by Kim Morris, for our studies of the landfast ice/pack ice interface in the East Siberian Sea and ice on shallow lakes the North Slope of Alaska. The East Siberian Sea ice study, a collaboration with Shusun Li (Geophysical Institute, UAF), used the original Geophysical Processor System (GPS) to obtain pack ice motion vectors and interferometry to examine landfast ice motion. Graduate student Ken Schwartz also placed many orders for his study of summer sea ice in Beaufort and Chukchi seas.
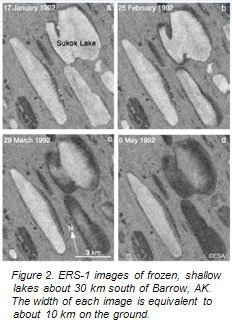
The lake ice study will always be a favourite because I had not previously studied any freshwater ice, and this, my first study of lake ice, was done in partnership with Willy Weeks, the first ASF Chief Scientist. The study was inspired by Willy’s earlier reports on interesting lake ice signatures in airborne X-band RAR and airborne X- and L-band SAR images (Weeks, et al., 1977, 1978). With ERS-1 data, we were able, for the first time, to follow at regular intervals the course of lake ice growth, grounding on the bottom (Figure 2) and decay between freeze-up in the autumn and break-up in the spring. This was possible because we had access to a large number of frequently acquired images, which were available in digital form and could, therefore, be studied using computer techniques.
Sigma-nought, a Macintosh application developed by Tony Freeman at JPL, was a wonderful tool that enabled our investigation of the changing backscatter of the lake ice. We also benefitted from the numerical modelling talents of Hiro Wakabayashi; his secondment to ASF from NASDA and his interest in doing more than observe ASF engineering activities contributed to a better understanding of the causes of backscatter variation from ice on shallow lakes. Another numerical modeller, Glen Liston (then at NASA GSFC, now at Colorado State University), simulated ice growth and thickness, and enabled us to map water depth variations from sequences of images of known date and thus simulated ice thickness, a proxy for the depth of water at the boundary between floating and grounded ice (Figure 2).
Being a “super user” was all very well, but it had its challenges, not the least when those many images had to be ordered. The original user interface, the Archive and Catalog System (ACS), provided no tools for seeing if your area of interest or target was in the images listed after the archive had been searched. For each image listed, you received its corner coordinates and then you were left to your own devices to determine if that image met your needs. It was rather hit or miss and certainly very timeconsuming. Today, ordering just the right image is much easier, thanks to the EOS Data Gateway with its map tool to show you exactly where the image that interests you is located relative to your target. But will there ever be an image browse capability to make ordering even easier?
I arrived at the Geophysical Institute in August 1985, six years before ERS-1 was launched and ASF began receiving its first SAR data in August 1991. As a GI researcher and, for a brief time, the ASF DAAC scientist, I have seen ASF conceived, born, grow and mature. There were certainly growing pains, and maturity has brought new challenges, but ASF has survived and thrived, even in occasional adversity. The GI and UAF, NASA and the foreign flight agencies, and most importantly, the community of SAR data users, have benefited from and been well served by ASF. I wonder what the next 15 years have in store and who will write about what for the period 2006-2021?
References
Fu, L.-L. and B. Holt. 1982. Seasat Views Oceans and Sea Ice with Synthetic Aperture Radar. JPL Publication 81-120.
Mueller, D.R., W.F. Vincent and M.O. Jeffries. 2003. Break-up of the largest Arctic ice shelfand associated loss of an epishelf lake. Geophys. Res. Lett., 30(20), 2031, doi:10.1029/2003GL01793.
Weeks, W. F., P. V. Sellmann, and W. J. Campbell. 1977. Interesting features of radar imagery of ice-covered North Slope lakes, J. Glaciol., 18(78), 129–136.
Weeks, W. F., A. J. Fountain, M. L. Bryan, and C. Elachi. 1978. Differences in radar returns from ice–covered North Slope lakes. J. Geophys. Res., 83(C8), 4069–4073.