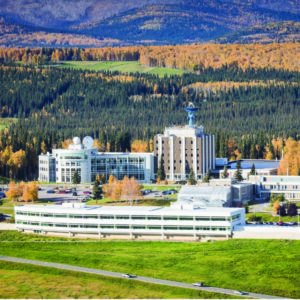
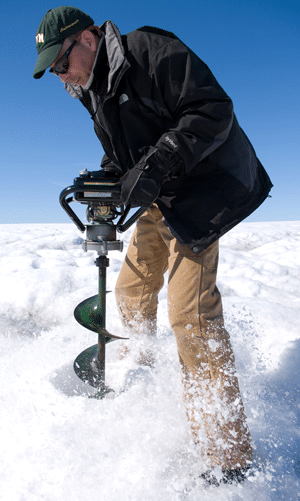
Ian Joughin is quite familiar with the Alaska Satellite Facility. That familiarity began during his time in graduate school and continued at the Jet Propulsion Laboratory in Southern California, where he began work in 1995.
It’s present in his current work as a glaciologist at the University of Washington Polar Science Center and in preparations for launch of the NISAR Earth-observing satellite in 2023.
And it will certainly be there in the future as he continues to use data coming through the Alaska Satellite Facility for his work monitoring the ice sheets of Greenland and Antarctica.
“It’s essential,” he said of the Alaska Satellite Facility. “Even though a lot of the data I’m using comes from European satellites, ASF has a much quicker way for me to access the data while I’m at the University of Washington.”
The Alaska Satellite Facility was key to his early work researching the Antarctic Ice Sheet using data from the European Space Agency’s two ERS satellites, launched in 1991 and 1995.
“There’s a lot of data from Antarctica from ERS that we got in the early days through ASF that wouldn’t have been acquired if ASF didn’t have a ground facility at McMurdo Station for a while,” he said.
For Ian, the Alaska Satellite Facility continues to be a vital component of his research with differential SAR interferometry to determine surface motion and topography of ice sheets, especially with his long-running Greenland Ice Mapping Project, which is part of NASA’s Making Earth Science Data Records for Use in Research Environments program.
“I get about a terabyte or two every month from ASF,” he said.
Ian was born in Montreal, Canada, but when he was 8 he and his family moved to Richford, Vermont, a small town on the Missisquoi River just inside the U.S.-Canada border and about 70 miles from his birthplace in Quebec.
He graduated from Richford Jr./Sr. High School, home of the Falcons, and obtained his bachelor’s and master’s degrees in electrical engineering from the University of Vermont. From there he attended the University of Washington, where he joined the Polar Science Center and obtained a Ph.D in electrical engineering in 1995.
With his brand-new Ph.D, Ian landed a spot at the Jet Propulsion Laboratory in 1995. While there, he continued using interferometry to measure ice velocities.
“It was about then that I started getting RADARSAT data from the Alaska Satellite Facility,” he said.
RADARSAT-1 was a joint U.S.-Canada project that launched in November 1995, with the satellite owned and operated by the Canadian Space Agency and the launch provided by NASA. The satellite operated from 1995 to 2013
At JPL, Ian served as an adviser for the RADARSAT Antarctic Mapping Mission, the first of two missions in the RADARSAT Antarctic Mapping Project. The first mission ran from Sept. 9, 1997 to Oct. 20, 1997.
The Alaska Satellite Facility processed data from both missions into images, which Ohio State University converted into maps and velocity fields.
Ian produced numerous papers involving interferometry while at JPL, not only in research into specific geographic areas but also on how best to use interferometry as a research tool.
One of those notable papers about how to use interferometry was published in 1996, not long after Ian started working at JPL.
In “Measurement of ice-sheet topography using satellite-radar interferometry,” Ian demonstrated the usefulness of the technique in producing detailed elevation models of Greenland and Antarctica, places he has traveled to several times since. Such maps did not exist for either place in those early years of satellite interferometry.
Another notable paper helped reveal the behavior of ice in West Antarctica. That 1999 paper, titled “Tributaries of West Antarctic ice streams revealed by RADARSAT interferometry,” drew on data from the Alaska Satellite Facility. The authors concluded that being able to measure the flow pattern of ice into West Antarctic ice streams through interferometric analysis of RADARSAT data “significantly changes the paradigm of how and where ice streams form.”
Ian left JPL in 2004 and returned to the University of Washington, this time as an employee of the Polar Science Center rather than a grad student.
While at the university, Ian used data from the Alaska Satellite Facility to produce a paper which made national news. “Marine ice sheet collapse potentially under way for the Thwaites Glacier Basin, West Antarctica” was published in 2014.
Ian was the lead author of that paper, which determined that the unstable glacier “has already entered the early stages of collapse, and rapid and irreversible collapse is likely in the next 200 to 1,000 years.”
The implications for sea level rise are extraordinary because of the glacier’s size: It is the widest on Earth, at about 80 miles, and encompasses 74,000 square miles, slightly larger than the state of Nebraska. That makes it one of West Antarctica’s largest potential contributors to sea level rise.
The Alaska Satellite Facility also figures into research he is conducting on the Taku Glacier in Southeast Alaska with principal investigator Jason Amundson, an associate professor of geophysics at the University of Alaska Southeast.
The tidewater glacier is transitioning into retreat after having advanced for the past century. The two researchers aim to record for the first time the changes in both glacier and sediment dynamics as a glacier moves from advance to retreat.
Ian also has a big role in a big upcoming mission that will rely heavily on the Alaska Satellite Facility: NISAR, a joint Earth-observing satellite mission of NASA and the Indian Space Research Organisation scheduled for launch in 2023 and which will use the Alaska Satellite Facility as a data repository. Ian is the leader of the cryosphere unit of NASA’s NISAR science team.
“The poles are difficult regions to access and are shrouded in darkness much of the year,” Ian said. “Prior to SAR observations, there were only scattered point measurements of ice flow speed made with GPS. Now we can routinely make velocity maps using the global constellation of SAR satellites. NISAR will improve upon these capabilities with more regular sampling — every 12 days — from both ascending and descending orbits with L-band, which is much more robust for making ice sheet measurements.”
•••
As with many longtime users of the Alaska Satellite Facility’s resources, Ian also has noticed the advances made over the years. Data no longer arrives on tapes or DVDs as it did in the early years of his work on the Greenland Ice Mapping Project.
“It’s changed a lot. In the old days, we would get exabyte tapes from ASF. And then it was nice when they actually went to DVDs because they could fit a long track on one DVD,” he said. “But for some projects I had several hundred DVDs. They would be mailing me a few of them every day, so I would have to wait months to get all that data shipped to me for one project.”
“It takes a long time to take 200 DVDs and feed them into your computer and load them,” he said. “Now I can get that much data by selecting it from the catalog and start downloading. And it will finish downloading overnight.”
And that makes for speedier research once the data is in his hands.
“And in a couple of days, I can tell you how fast every glacier in Greenland was moving last month.”


