Glacier Speed

Alaska Glacier Flow Speed, 2007-2011
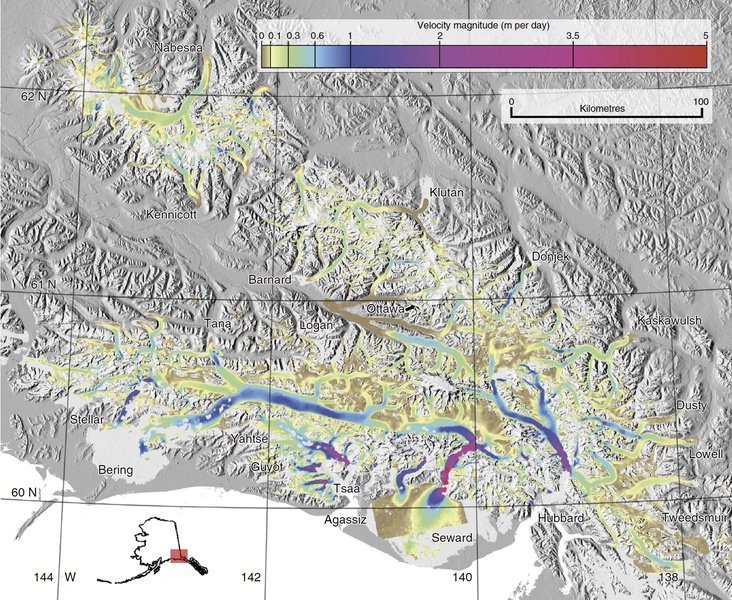
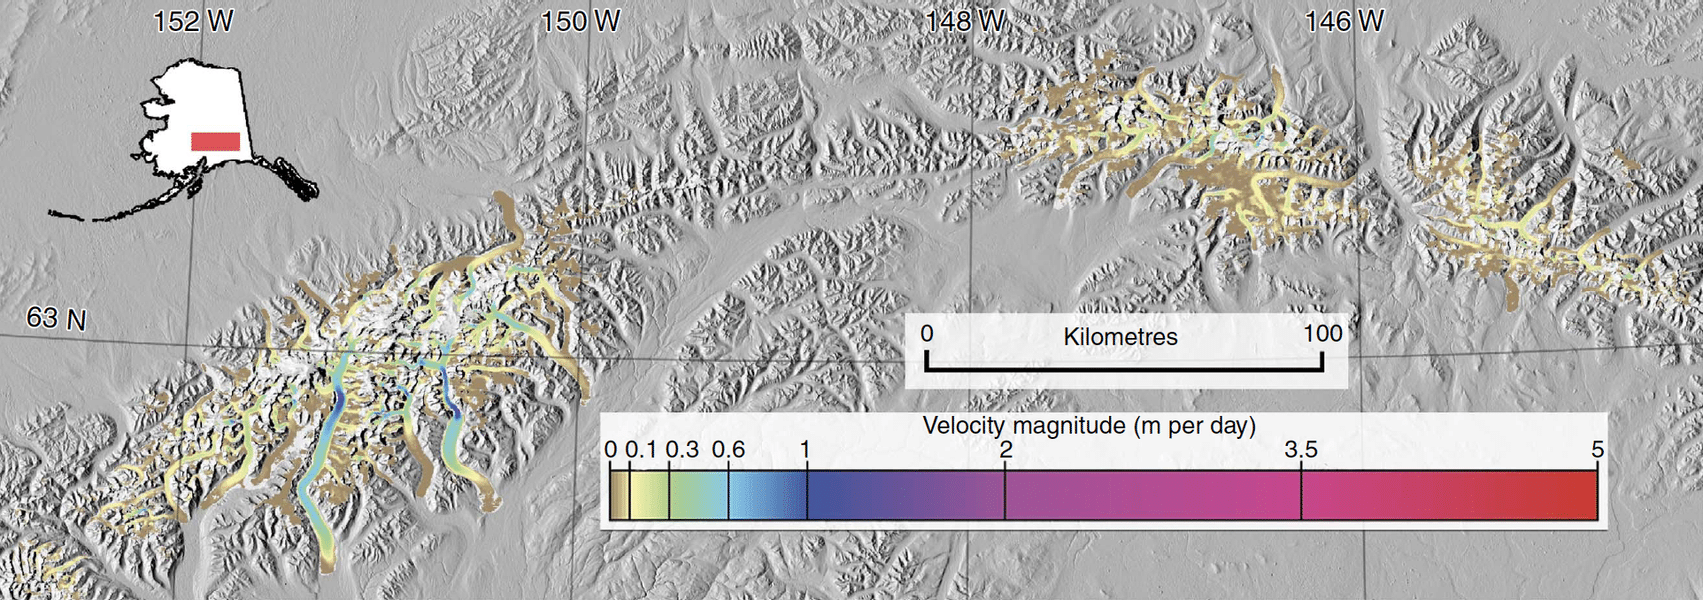
The first near-comprehensive dataset of wintertime glacier-flow speeds throughout Alaska — available here and described in Burgess et al., Nature Communications, 2013 — reveals complex patterns of glacier flow throughout the state. The findings significantly advance understanding of the mechanisms responsible for the rapid glacier mass loss occurring in Alaska.

The dataset was produced by Evan Burgess and colleagues at the University of Utah and the University of Alaska Fairbanks using ALOS PALSAR data. Detailed information on its production is available in Burgess, E. W. et al. Flow velocities of Alaskan glaciers. Nat. Commun. 4:2146 doi: 10.1038/ncomms3146 (2013).

Expand the sections below to view content. Access the full content on a single page by clicking the button.
Alaska is losing about 50 cubic km of ice per year, but much of the new-water sea-level rise expected over the next 100 years may come from changes in mountain glacier calving and ice flow, which are completely unconstrained and unincorporated into mass loss projections.
Over half of the downstream ice flux from more than 20,000 glaciers throughout Alaska comes from fewer than 12 coastal glaciers. The flow dynamics on these rapid-flow systems will operate differently than from those of other glaciers, because they are able to maintain higher flow speeds without losing mass. Understanding the dynamics of these glaciers is critical for future efforts to estimate flow-speed-related mass loss in Alaska.
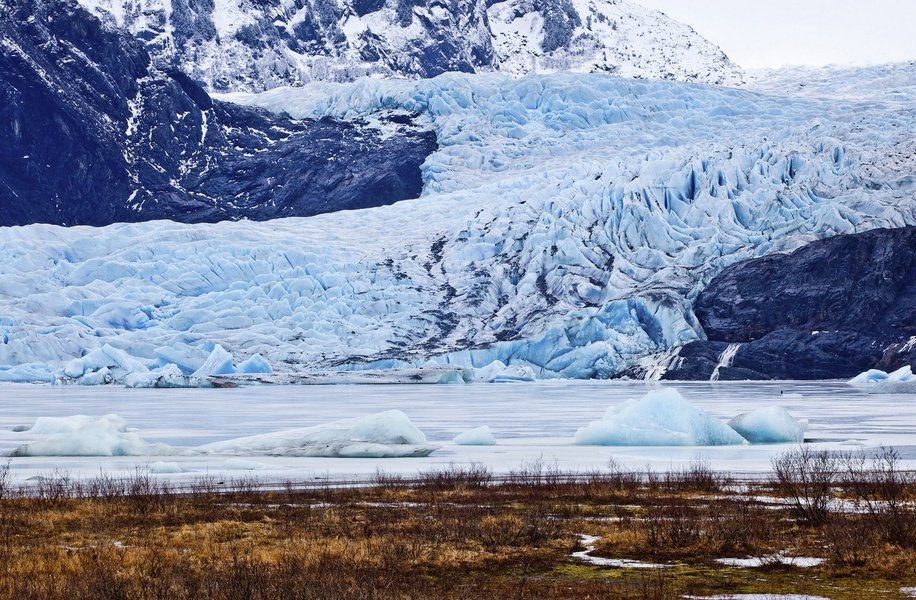
Icebergs float from the calving Mendenhall glacier, which originates in Alaska’s Coast Range. The glacier velocity dataset reveals that about 40 percent (approximately 20 cubic km) of ice lost annually in Alaska is due to calving alone, mostly from a few coastal glaciers. © UAF Improving projections of future sea level rise will require a thorough understanding of how climate change will affect glacier flow speeds. Flow speeds of ocean-calving glaciers originating from ice sheets have been closely monitored for many years, leading to better understanding of ocean-ice sheet interactions. But flow velocities of mountain glaciers have not been as widely monitored as ice sheets, and current projections of mountain-glacier mass loss are limited to extrapolating melt and snowfall observations on only a few glaciers to large regions.
Glacier surface velocities were derived using ALOS PALSAR fine beam data (L-Band, HH Polarization, 46-day orbit interval) provided through ASF. Repeat image pairs, acquired within one- to two-orbit intervals, were used to measure the ground displacement of features on glacier surfaces, such as crevasses or Synthetic Aperture Radar (SAR) speckle. Ground displacement was measured using image cross correlation, which provides estimates of flow speed both in azimuth and range directions. Displacements were calculated from slant-range Single Look Complex (SLC) files, then geocoded, topographically corrected, and corrected for image co-registration.
The final data products released here provide highly accurate estimates of flow speed; uncertainties are generally below 2 cm/day and overall biases are < 3 mm/day. While the data products are gridded at 90 m resolution, the method’s true spatial resolution is about three times larger due to the size-correlation windows. Nonetheless, these data are still able to resolve flow on Alaska glaciers of all sizes and speeds.
Region and timing: The dataset includes flow speeds of glaciers in the Wrangell-St. Elias Mountains, the Chugach Range, Kenai Peninsula, the Tordrillo and Necola Ranges, the Fairweathers, the Alaska Range, Glacier Bay, and the Coast Mountains of Southeast Alaska. Custom software was used to manually identify which of 344 image pairs could best represent each glacier and then mosaic chosen velocity fields together. In total, about 60 frames were chosen to produce the final maps. All images were acquired in winter between 2007 and 2010 (most were in January of 2008 and 2010). There were significant temporal changes in wintertime velocity, so continuity within each glacier basin was prioritized above optimal spatial coverage. Also, given the sometimes-erratic changes in velocity, the researchers caution against using these data to look at long-term trends in velocity.
Data format: The dataset available here includes geocoded grids of flow speed, metadata, and a Google Earth visualization of the full dataset for educators and scientists. The Google Earth visualization is self-explanatory for anyone with Google Earth. The metadata include geocoding information and the acquisition timing of the mosaicked flow-speed map.
For more information, see Burgess, E. W.; Forster, R.R.; and Larsen, C.F., Flow velocities of Alaskan glaciers. Nat. Commun. 4:2146 doi: 10.1038/ncomms3146 (2013).
Citing Glacier Speed Data or Imagery
Cite data in publications such as journal papers, articles, presentations, posters, and websites. Please send copies of, or links to, published works citing data, imagery, or tools accessed through ASF to [email protected] with “New Publication” on subject line.
| Format | Example |
|---|---|
| Dataset: Glacier Flow Speed, Burgess et al. 2013. Retrieved from ASF [day month year of data access]. Includes Material © JAXA/METI 2007-2011, archived at ASF DAAC. | Dataset: Glacier Flow Speed, Burgess et al. 2013. Retrieved from ASF 7 June 2015. Includes Material © JAXA/METI 2007-2011, archived at ASF DAAC. Recommended: Also cite first publication of findings: Burgess, E. W. et al. Flow velocities of Alaskan glaciers. Nat. Commun. 4:2146 doi: 10.1038/ncomms3146 (2013). |
Crediting Glacier Speed Imagery
| Format | Example |
|---|---|
| Dataset: Glacier Flow Speed, Burgess et al. 2013. Retrieved from ASF [day month year of data access]. Includes Material © JAXA/METI 2007-2011, archived at ASF DAAC. | Dataset: Glacier Flow Speed, Burgess et al. 2013. Retrieved from ASF 7 June 2015. Includes Material © JAXA/METI 2007-2011, archived at ASF DAAC. Recommended: Also cite first publication of findings: Burgess, E. W. et al. Flow velocities of Alaskan glaciers. Nat. Commun. 4:2146 doi: 10.1038/ncomms3146 (2013). |
For General Users and Educators: Google Earth Map
Download the .kmz file that can be opened in Google Earth to show the statewide glacier-flow-speed map. Flow-speed is shown by color, as indicated in the scale at the bottom of the Google Earth screen. If clicking on the .kmz file gives you a message about a previous version of Google Earth, drag the file onto your Google Earth icon.
For Scientists: Data Products
Contents:
- Readme file
- Three files (_speed.tif, _ids.tif, and .par) for each of the following regions:
- Central Alaska Range
- Chugach Mountains
- Coastal Range
- Delta Range
- Fairweather Range — Glacier Bay
- Hayes Range
- Kenai Mountains
- Tordrillo Mountains
- Wrangell Mountains — St. Elias Mountains
The flow-speed data are gridded on 90-meter-resolution UTM grids as GeoTIFFs. The grids are divided into different regions and include a _speed file that contains the mosaicked flow speed in meters/day (32-bit float) and a _ids file that contains integer IDs that correspond to the image pair used for determining flow speed at each pixel (16-bit integer).
The dates of the image pairs used can be found by looking up image IDs in the corresponding .par file. In some cases, the .par file will contain IDs that are not in the _ids grid. In these cases, these image pairs were simply not needed in the final mosaic. The .par file also includes georeference information in a text format.
