
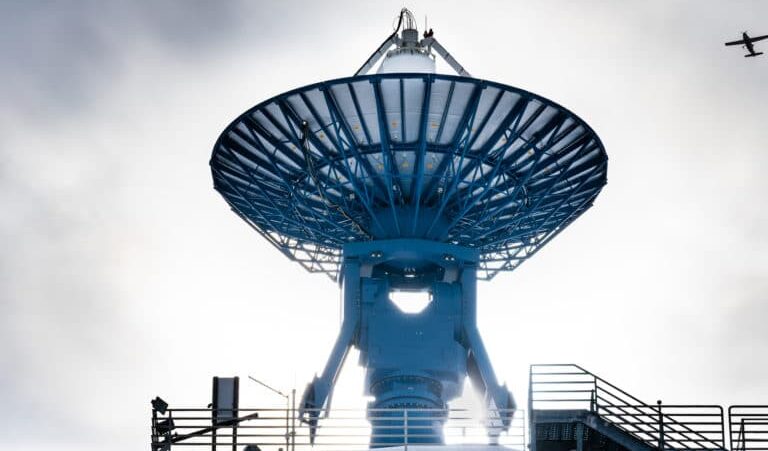
Unlike the aperture in a camera, which opens to let in light, radar aperture is another term for the antenna on the spacecraft or aircraft. The radar antenna first transmits electromagnetic energy toward Earth and then receives the returning energy after it reflects off of objects on the planet. In the NASA image below, the radar antenna is the rectangle at the Earth end of the 1978 Seasat satellite. The data collected by the radar antenna are then transmitted to another kind of antenna on Earth — such as the antennas of the ASF Satellite Tracking Ground Station — so they can be stored and processed.
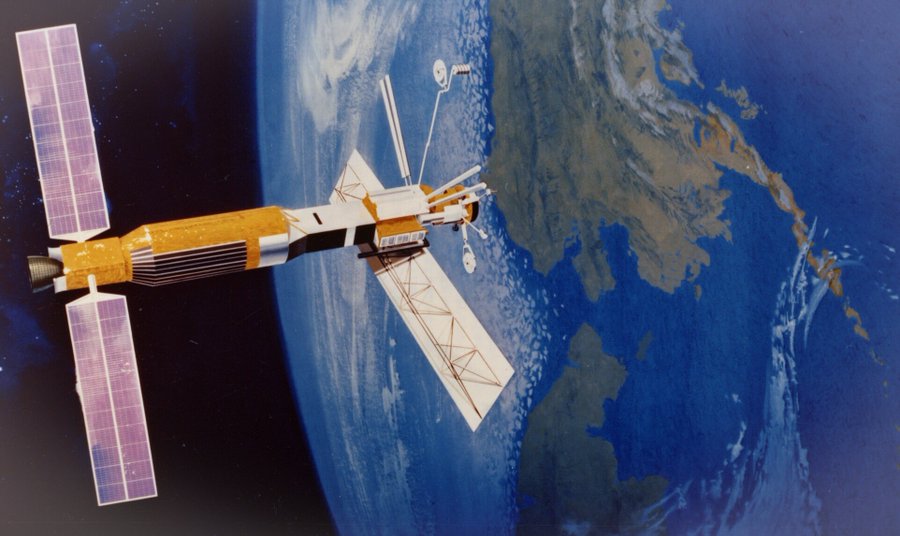
In general, the larger the antenna, the more unique information scientists can obtain about an object — and the more information, the better the image resolution. However, antennas in space are not large. So scientists use the spacecraft’s motion, along with advanced signal-processing techniques, to simulate a larger antenna.
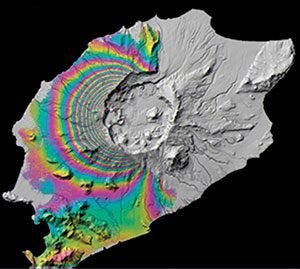
Synthetic aperture radar (SAR) interferometry (InSAR) detects motion or elevation by comparing radar signals from two or more images of the same scene. The images are taken at different times from the same vantage point in space. SAR interferometry is often used to detect surface changes (for use in seismology, for example) or to generate digital elevation maps. The InSAR image below shows deformation on Okmok, a volcano in the Aleutian Islands. Image courtesy of Zhong Lu, © ESA 2008.
Because the radar wavelength is longer than particles in a cloud, such as droplets, the signal traveling through a cloud is mostly unaffected by any refraction at the boundaries of the different media.
In microwave remote sensing, scientists measure the time and magnitude of the signal backscattered from the ground to the radar antenna. The magnitude of the signal defines the brightness of a given pixel in the image. The resulting image has a grayscale. Scientists sometimes colorize SAR images to highlight certain data or features.
The interpretation of synthetic aperture radar (SAR) images is not straightforward. The reasons include the non-intuitive, side-looking geometry. Here are some general rules of thumb:
- Regions of calm water and other smooth surfaces appear black (the incident radar reflects away from the spacecraft).
- Rough surfaces appear brighter, as they reflect the radar in all directions, and more of the energy is scattered back to the antenna. Rough surface backscatter even more brightly when it is wet.
- Any slopes lead to geometric distortions. Steeper angles lead to more extreme layover, in which the signals from the tops of mountains or other tall objects “lay over” on top of other signals, effectively creating foreshortening. Mountaintops always appear to tip towards the sensor.
- Layover is highlighted by bright pixel values. The various combinations of the polarization for the transmitted and received signals have a large impact on the backscattering of the signal. The right choice of polarization can help emphasize particular topographic features.
- In urban areas, it is at times challenging to determine the orbit direction. All buildings that are perfectly perpendicularly aligned to the flight direction show very bright returns.
- Surface variations near the size of the radar’s wavelength cause strong backscattering. If the wavelength is a few centimeters long, dirt clods and leaves might backscatter brightly.
- A longer wavelength would be more likely to scatter off boulders than dirt clods, or tree trunks rather than leaves.
- Wind-roughened water can backscatter brightly when the resulting waves are close in size to the incident radar’s wavelength.
- Hills and other large-scale surface variations tend to appear bright on one side and dim on the other. (The side that appears bright was facing the SAR.)
- Due to the reflectivity and angular structure of buildings, bridges, and other human-made objects, these targets tend to behave as corner reflectors and show up as bright spots in a SAR image. A particularly strong response — for example, from a corner reflector or ASF’s receiving antenna — can look like a bright cross in a processed SAR image.
In ASF’s full-resolution synthetic aperture radar (SAR) images, objects can be distinguished as small as about 30 meters wide. Some of the smaller items scientists have spotted have been ships and their wakes. When the synthetic aperture radar (SAR) happens to be aligned at a certain angle, long thin objects such as roads or even the Alaskan oil pipeline can also be seen. Objects can be much smaller than the resolution and still be observable such as bright point objects. They only need to be perfectly aligned with the look direction of the synthetic aperture radar (SAR) sensor.
As the spacecraft moves along in its orbit, the radar antenna transmits pulses very rapidly in order to obtain many backscattered radar responses from a particular object. The synthetic aperture radar (SAR) processor could use all of these responses to obtain the object’s radar cross-section (how brightly the object backscattered the incoming radar), but the result often contains quite a bit of speckle. Generally considered to be noise, speckle can be caused by an object that is a very strong reflector at a particular alignment between itself and the spacecraft, or by the combined effect of various responses all within one grid cell. To reduce speckle, the data are sometimes processed in sections that are later combined — called looks. The more looks used to process an image, the less speckle. However, resolution is reduced, and information is lost in this process. Several research groups are developing/improving algorithms to reduce speckle while saving as much accurate information as possible.
Noise is defined as random or regular interfering effects that degrade the data’s information-bearing quality. Speckle is a scattering phenomenon that arises because the resolution of the sensor is not sufficient to resolve individual scatterers. Physically speaking, speckle is not noise, as the same imaging configuration leads to the identical speckle pattern. Speckle is removed by multi-looking. See “What is a ‘look'” above.
After the radar sends its microwave signal toward a target, the target reflects part of the signal back to the radar antenna. That reflection is called backscatter. Various properties of the target affect how much it backscatters the signal.
IfSAR is another term for InSAR. InSAR is the more common term, particularly for satellite-borne sensors. IfSAR has been used more by the military and/or for airborne sensors.
Consult ASF’s Get Started page.
Layover is a type of distortion in a synthetic aperture radar (SAR) image. The radar is pointed to the side (side-looking) for imaging. Radar signals that return to the spacecraft from a mountaintop arrive earlier or at the same time as the signal from the foot of the mountain, seeming to indicate that the mountaintop and the foot of the mountain are in nearly the same place, or the mountaintop may also appear “before” the foot. In a synthetic aperture radar (SAR) image with layover, the mountains look as if they have “fallen over” towards the sensor.
Where features are shifted from their actual location, the resulting geolocations are incorrect. This effect can be removed by the technique of terrain correction (also see “What is terrain correction?” below).
As with shadows from sunlight, shadows in synthetic aperture radar (SAR) images appear behind vertical objects. Mountains may appear to have black shadows behind them, depending on the steepness of the slope. The shadows appear black because no radar signals return from there.
Radiometric correction involves removing the misleading influence of topography on backscatter values. For example, the correction eliminates bright backscatter from a steep slope, leaving only the backscatter that reveals surface characteristics such as vegetation and soil moisture.
© JAXA/METI 2008.
Terrain correction is the process of correcting geometric distortions that lead to geolocation errors. The distortions are induced by side-looking (rather than straight-down looking or nadir) imaging, and compounded by rugged terrain. Terrain correction moves image pixels into the proper spatial relationship with each other. Mountains that look as if they have “fallen over” towards the sensor are corrected in their shape and geolocation.
Material © JAXA/METI 2008.
The RTC products ASF generated for the ALOS PALSAR mission include a copy of the DEM used to process the RTC. Note that this DEM is not generated from current SAR data, but is a geoid-corrected version of the best publicly-available DEM for the area covered by the RTC product. Sources vary depending on the area, but generally use either the SRTM (Shuttle Radar Topography Mission) or 3DEP (3D Elevation Program, including seamless products formerly called NED) DEMs.
For more information on the DEMs included in the RTC product, visit the ALOS PALSAR RTC page.
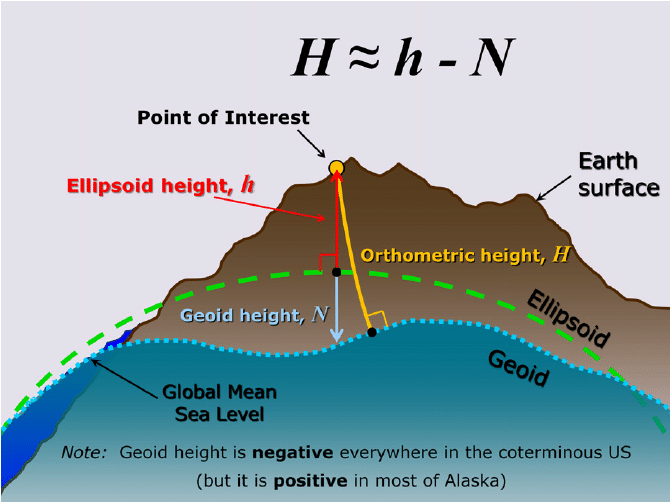
Most digital elevation models (DEM) are geoid-based and require a correction before they can be used for terrain correction. The DEM included in an ASF radiometrically terrain corrected (RTC) product file was converted from source DEM orthometric height to ellipsoid height using the ASF MapReady geoid_adjust tool. This tool applies a geoid correction so that the resulting DEM relates to the ellipsoid.
An online tool is available that computes the height of the geoid above the WGS84 ellipsoid, and will show the amount of correction that was applied to the source DEM used in creating an RTC product.
Orthorectification corrects geometric distortions in imagery, just as terrain correction does (see “What is terrain correction?” above). The term ‘orthorectification’ is used more often in association with aerial and optical imagery. Terrain correction generally refers to synthetic aperture radar (SAR) imagery.
A georeferenced image has the location of the four corners of the image and the information needed to put the data into a projection. Geocoded data is already projected. Each point in the image is associated with a geographic coordinate.
C-band (~5.3 GHz)
Applies to ERS-1, ERS-2, RADARSAT-1, Sentinel-1
– Variety of applications, but particularly sea ice, ocean winds, glaciers.
L-band (~1.2 GHz)
Applies to PALSAR, UAVSAR, AIRSAR, JERS-1, Seasat
– Provides vegetation penetration
– Applications included sea ice, tropical forest mapping, soil moisture
– Subject to ionospheric effects
P-band (~0.4 GHz)
Applies to some products of UAVSAR
– Greatest penetration depth through vegetation and into soil
– Ideal for soil moisture and biomass
– Difficult to operate from space due to ionospheric effects