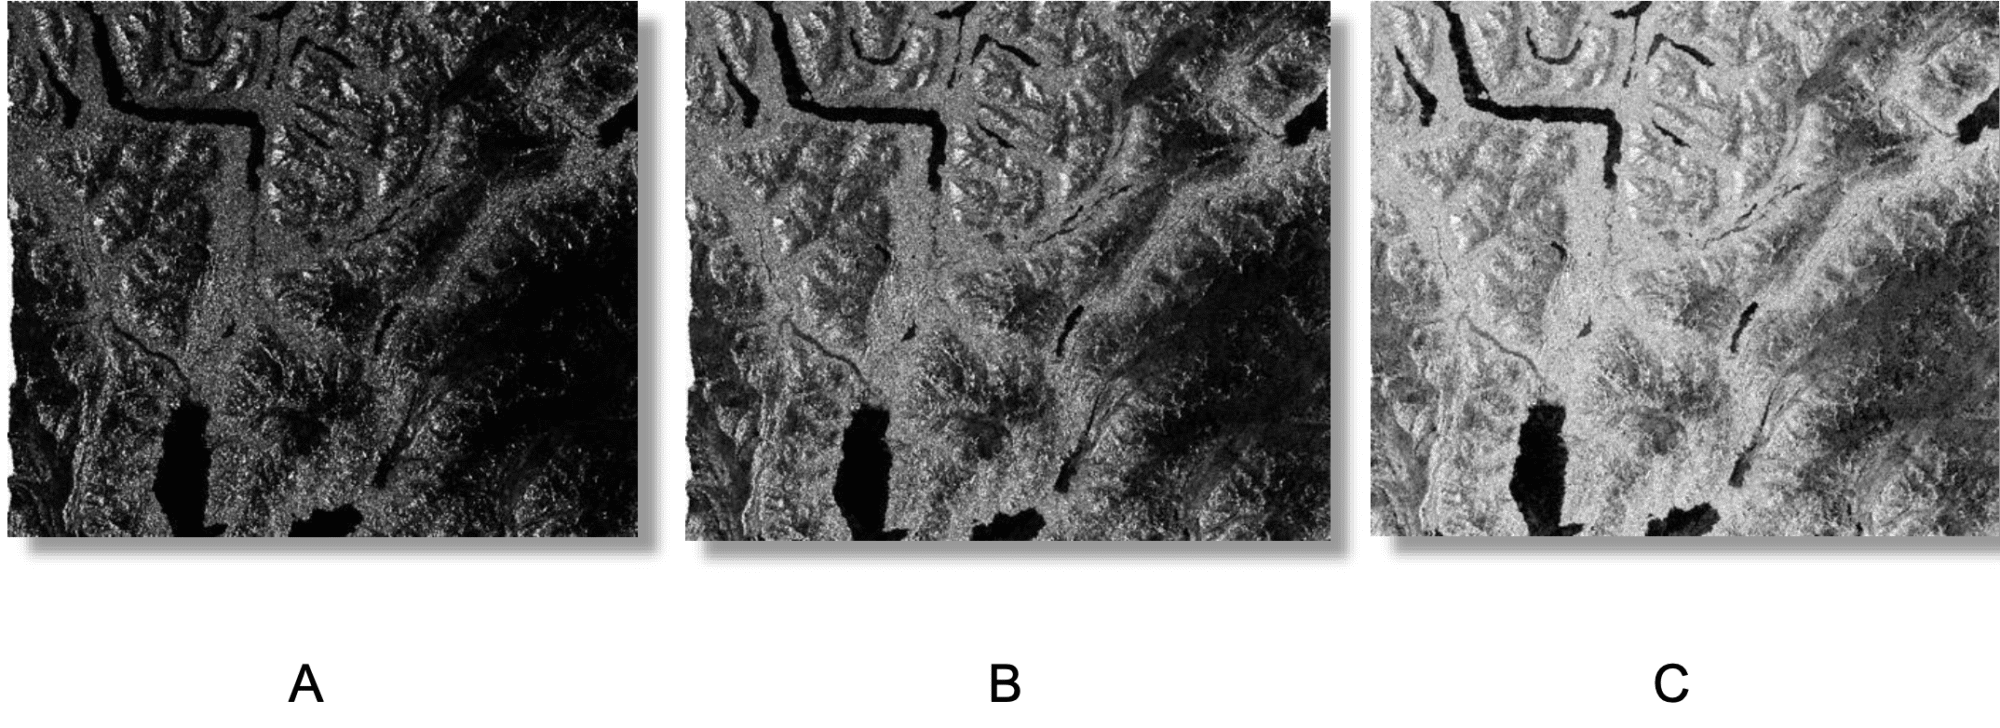
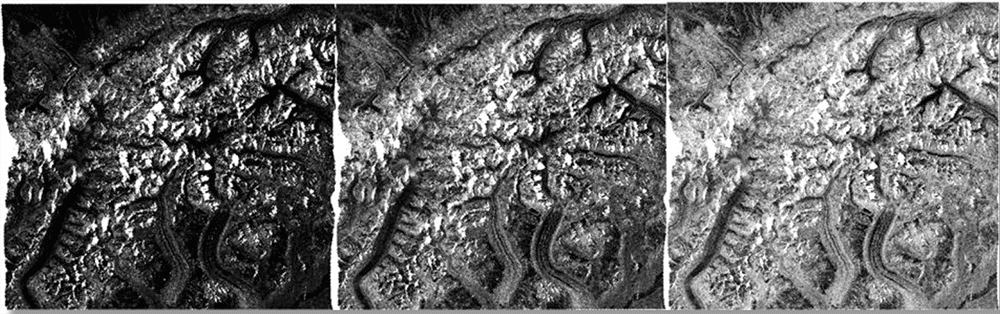
A portion of the Alaska Range in Denali National Park in (A) RTC Gamma0 Image, (B) Amplitude Image, (C) dB Power Image. Credit: ASF DAAC 2016; Includes Material ©JAXA/METI 2006.
Source: Rick Guritz, ASF
● Easier (Windows): Convert power (dark) to db (light)
Background
The standard output of the RTC process is a gamma0 power image. This format supports statistical assessments of the data. However, when displayed in GIS software, data in power format is dark, making it difficult to use for visual analysis. There are two common ways to deal with this in a GIS environment: convert the power scale to amplitude, or convert it to decibels (dB). A comparison is available in the Example Images section; however, dB-converted images are generally preferred for visualization.
Prerequisites
Materials List:
- Windows, Mac, or Linux
- RTC Image
- Options to obtain image:
- Download and unzip this sample granule
- Download an RTC ALOS PALSAR image using Vertex
- Process an RTC image from Sentinel-1 Data
- Options to obtain image:
- QGIS
Note: You will be prompted to enter your Earthdata Login username and password, or must already be logged in to Earthdata before the download will begin.
Steps
Open QGIS
Load an RTC image
- Click Layer > Add Layer > Add Raster Layer or use Add Raster icon
- Browse to the directory of your RTC image
- Hold down the Shift or Ctrl key on your keyboard to select multiple images
- Click OK
- You will see the image load in the legend area
Note: The maximum file size QGIS supports is 4 GB for classical TIFF, but no limits for BigTIFF. See the Optional — Create a Subset of your Image step below if you would like to create a subset of your image.
Open the Raster Calculator
- Navigate to Raster > Raster Calculator from the main menu
- Calculate the following conversions, double-click on the file names to add to the expression:
- Amplitude: sqrt(“RTC filename”)
- Decibel (dB): 10 * Log10(“RTC filename”)
- Set the Output Layer to a filename and directory of your choice and select OK

Improve Visualization at all Spatial Scales
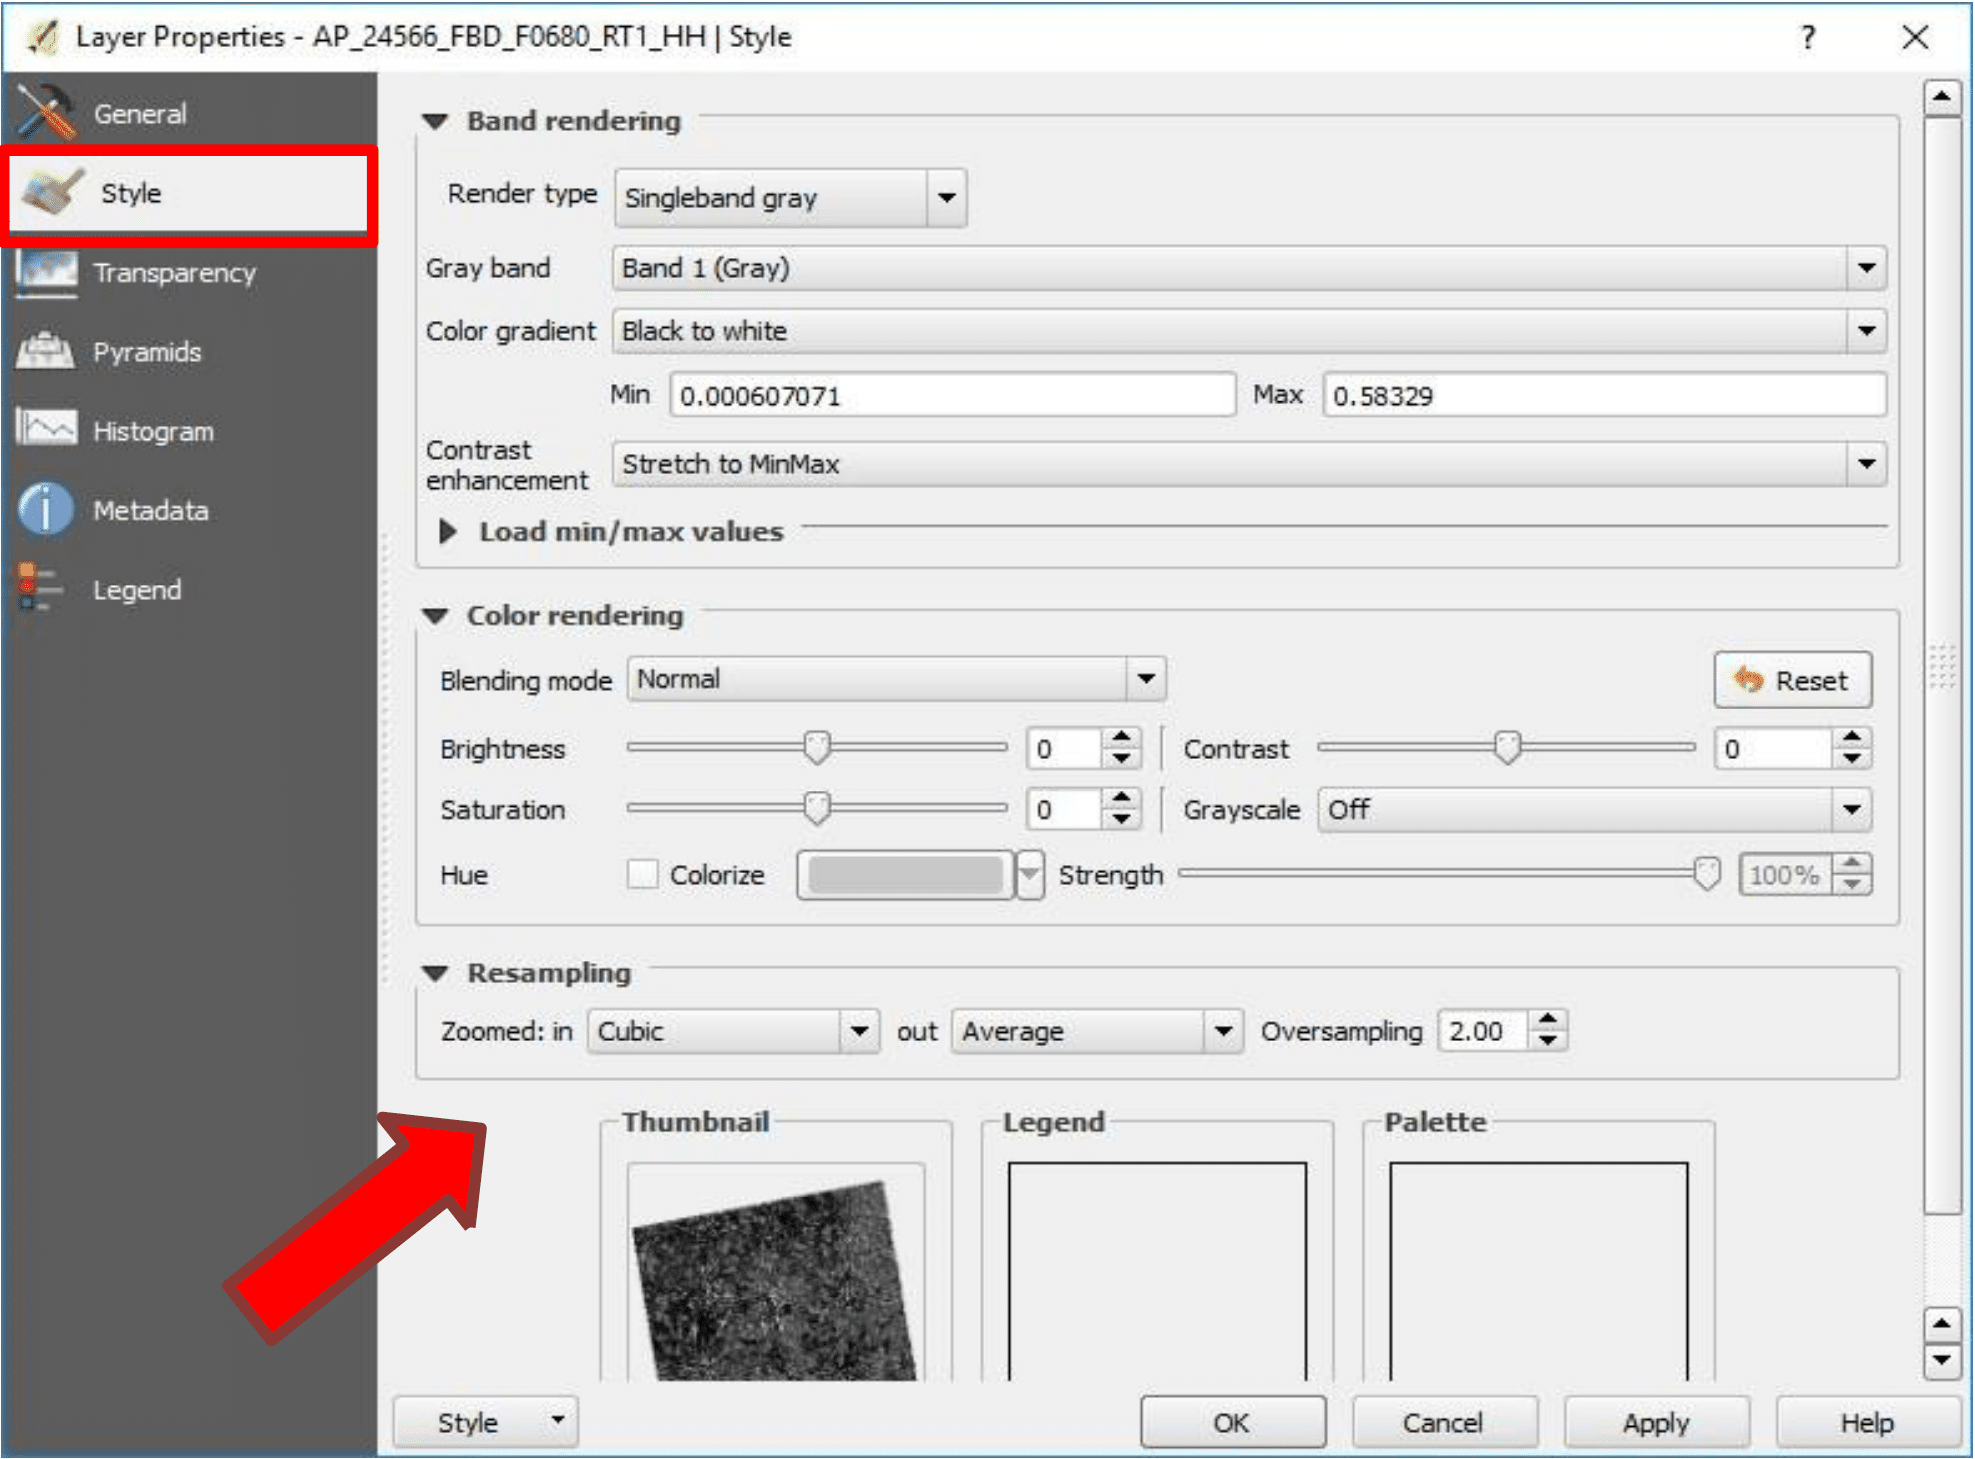
- Right-click on the image in the Layers Panel and select Properties
- In the Layer Properties window, click on Style
- Change the resampling method for Zoomed: in to Cubic, and Zoomed: out to Average, select OK
Optional — Add a base layer to compare image features to known landmarks
- Load the OpenLayers Plugin into your QGIS system via the Plugins > Manage and Install Plugins… item in the menu bar at the top of the QGIS interface

- Open a base layer by using the top menu, Web > Open Layers plugin
Note: The base layer used in the Raster Calculator dialog image in the Open the Raster Calculator step can be found in Web > OpenLayers plugin > Google Maps > Google Hybrid.
- In the Layers Panel in the lower-left corner, drag and drop the base layer so that it is below the log-ratio layer.
Optional — Create a Subset of your Image
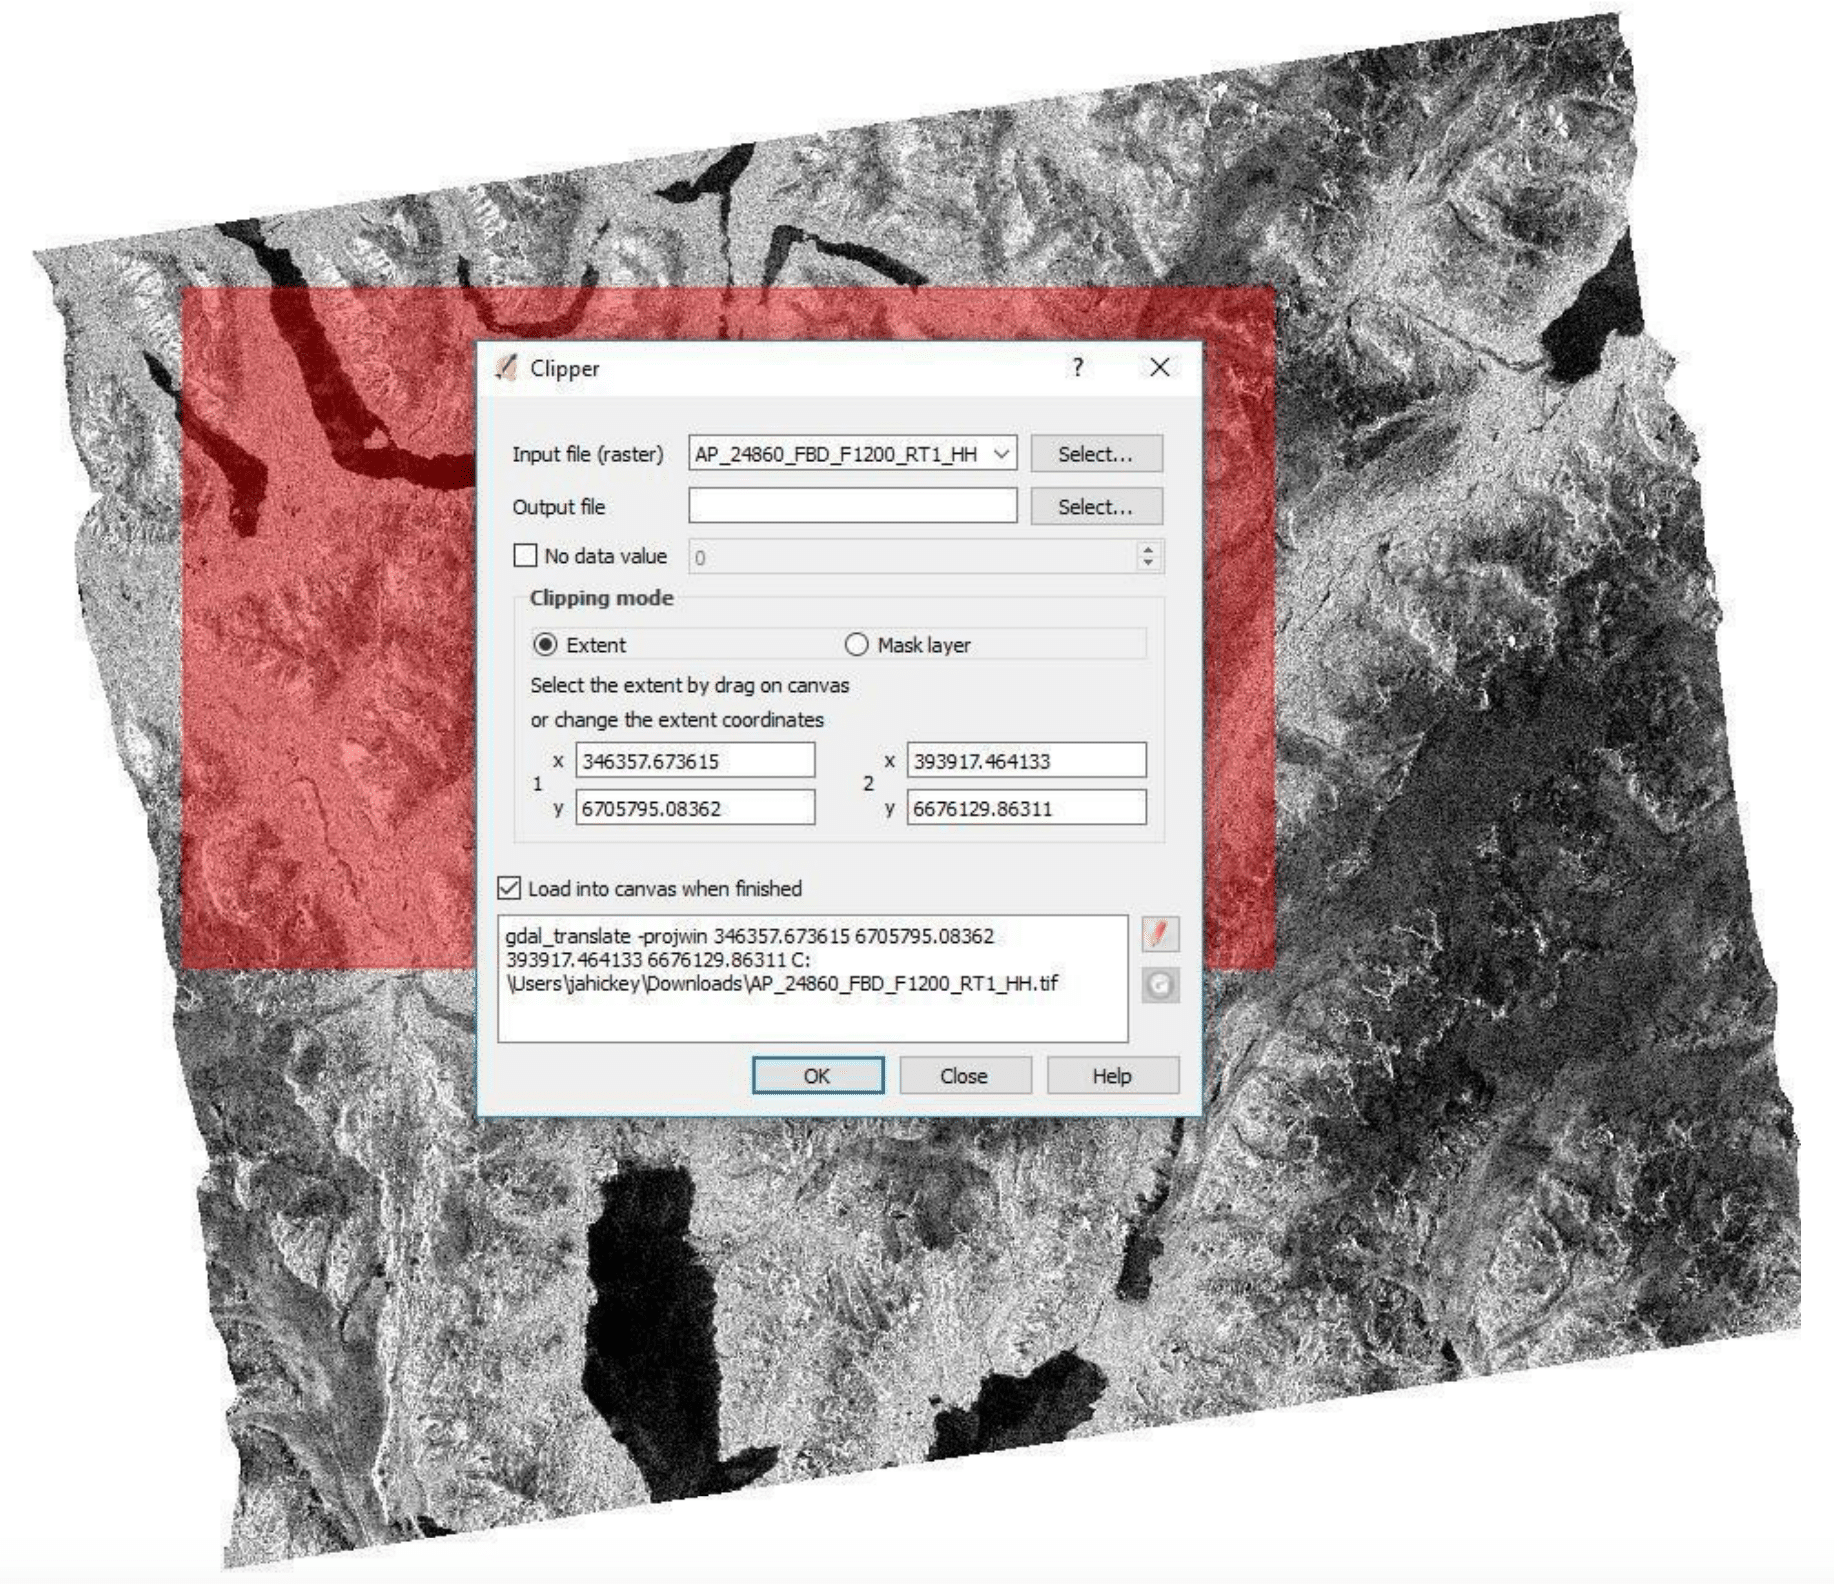
If the data you are using is too large or you simply have a particular area of interest, you may use the Clipper tool in QGIS to crop your image and cut down on the processing time.
- Navigate to Raster > Extraction > Clipper… from the main menu
- In the Clipper dialog, select the product you would like to clip
- There are two ways to clip your image:
- Select the extent by click-dragging your cursor on the canvas. You may adjust the extent coordinates as you see fit (x, y)
- Use a Mask layer (shape file) to clip out a particular shape
- Set the Output file to a filename and directory of your choice, click OK
Example Images