Source: ASF Staff
● Easier
Background
Radiometric correction removes the misleading influence of topography on backscatter values in synthetic aperture radar (SAR) images. Terrain correction corrects geometric distortions that lead to geolocation errors. The distortions are induced by side-looking (rather than straight-down looking, or nadir) SAR imaging and are compounded by rugged terrain. Terrain correction moves image pixels into the proper spatial relationship with each other. Radiometric terrain correction combines both corrections to produce a superior product for science applications.
Radiometric Terrain Correction is a fairly standard and straightforward process. The Sentinel-1 Toolbox (S1TBX) offers a graph processing tool (GPT) that can be used to automate the creation of RTC images as well as many other processes. This recipe will go over the steps to create a graph and how to batch process one or more images.
Prerequisites
Materials List:
- The latest version of the Sentinel-1 Toolbox
- Inside the software, navigate to Help > Check for Updates to ensure it is updated. This recipe was tested with Sentinel-1 Toolbox version 6.0.3.
- At least one Sentinel-1 GRD product. The product used in this recipe can be downloaded by clicking on this link:
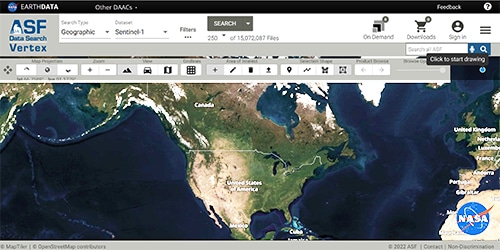
- You can find other Sentinel-1 GRD products by using the ASF Vertex Data Portal.
System Requirements:
- Windows or Mac OS X
- 32 GB or more RAM
Note: A Solid State Drive is faster than a Hard Disk Drive and will significantly improve performance when processing large files.
Steps to Create and Run an RTC Graph
Open the Product(s) in Sentinel-1 Toolbox
- Open the Sentinel-1 Toolbox.
- Use the Open Product button in the top toolbar and browse to the location of the GRD product.
- Select the zip file, then click Open.
- Hint: Press and hold the Ctrl (Windows) or Command (Mac) key to select multiple files.
Important: Do not unzip the file(s) after downloading. If you did, select the manifest.safe file from each Sentinel-1 product folder.
View the Products (Optional)
- The product(s) will appear in the Sentinel-1 Product Explorer window.
- Double-click on a product to expand.
- Expand the Bands folder and you will find two bands for each polarization: an amplitude band and a virtual intensity band.
- To view the data, double-click on the Amplitude_VH band.
- Zoom in using the mouse wheel. Pan by clicking and dragging the left mouse button in the Navigation tab under the Product Explorer window. The World View tab shows the location of the product(s) on a world map.
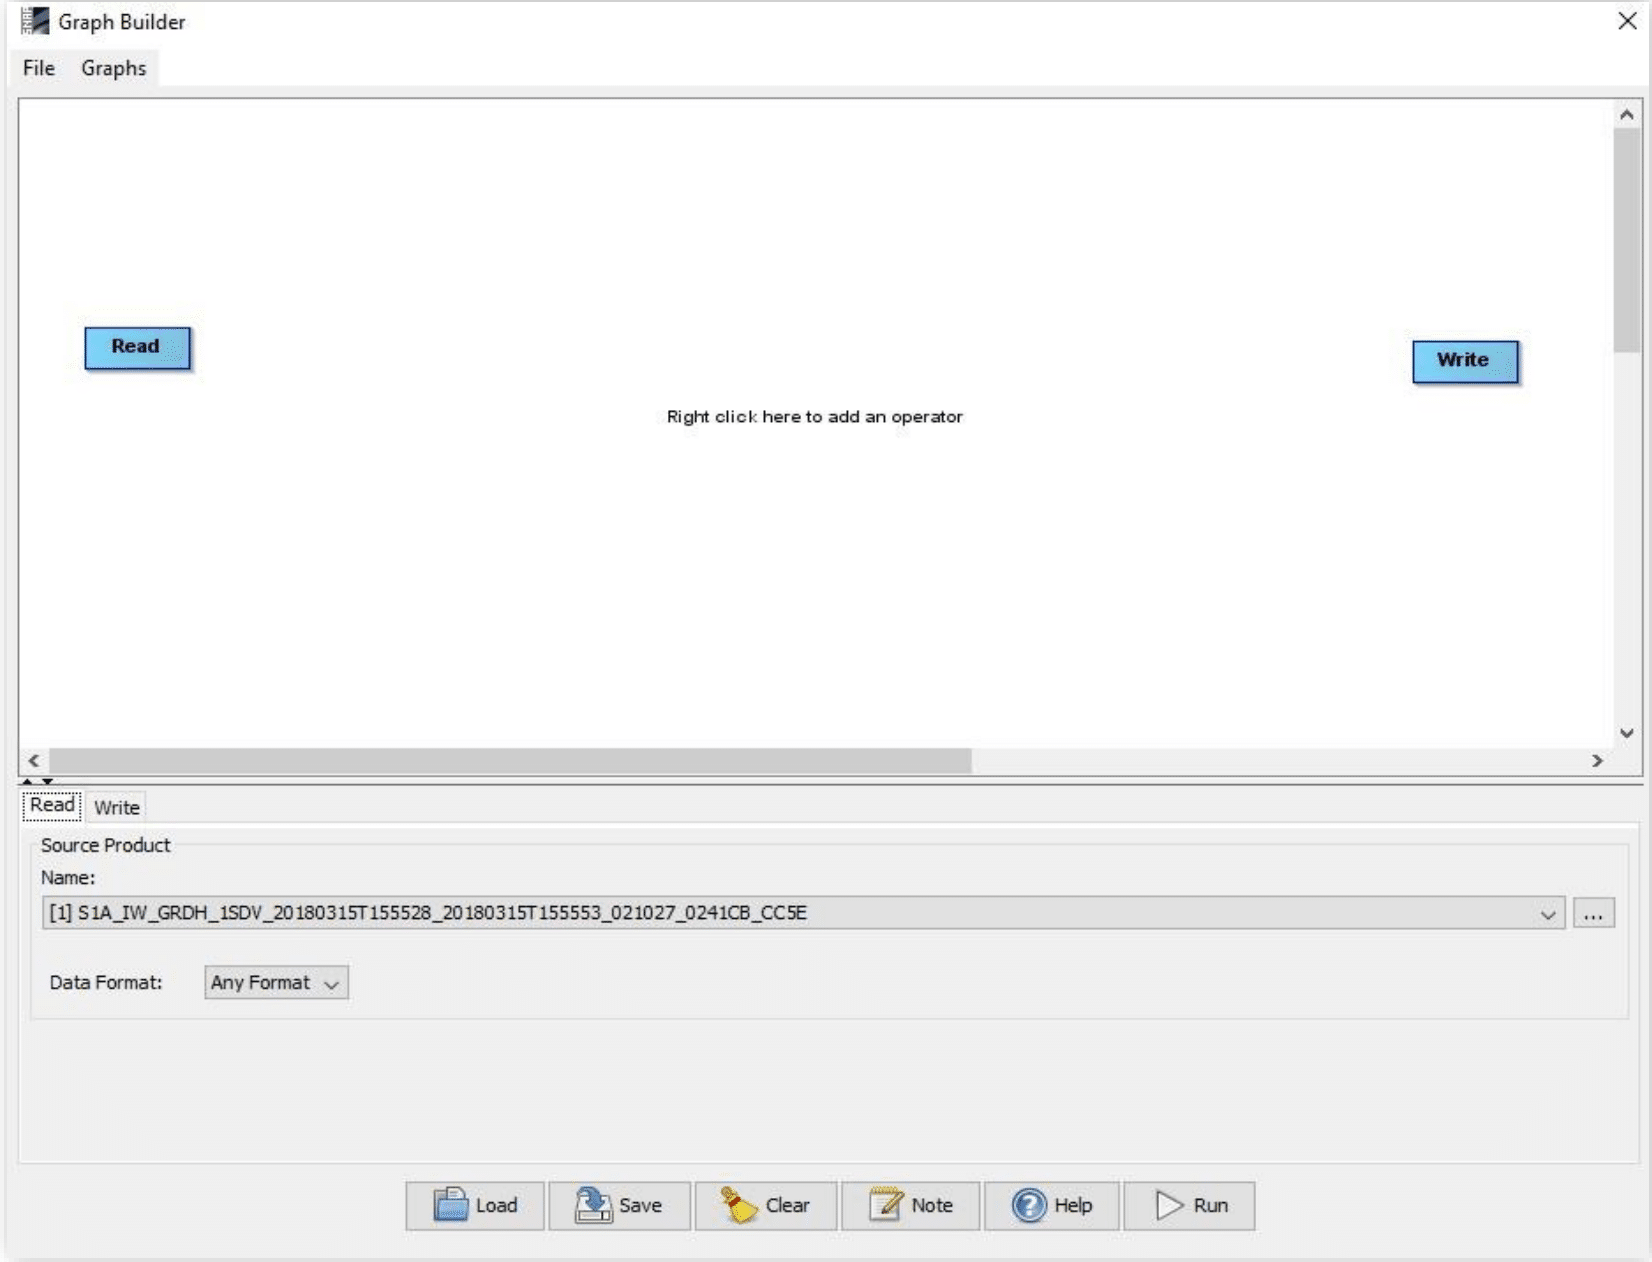
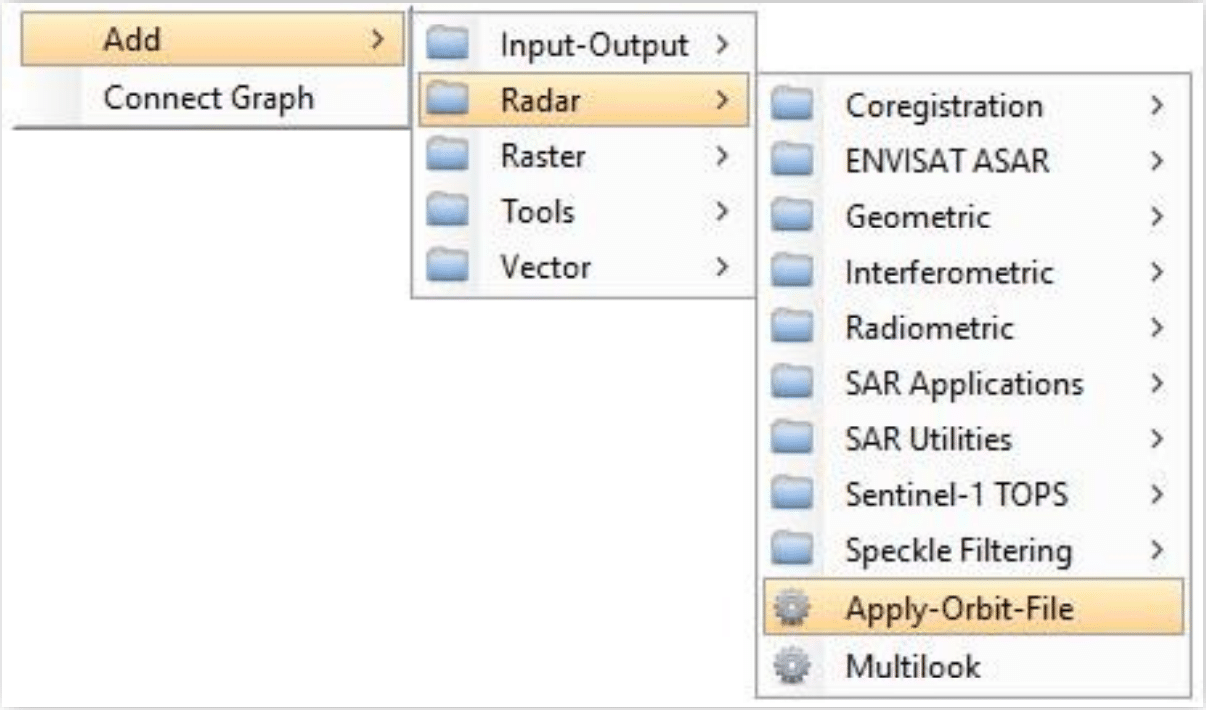
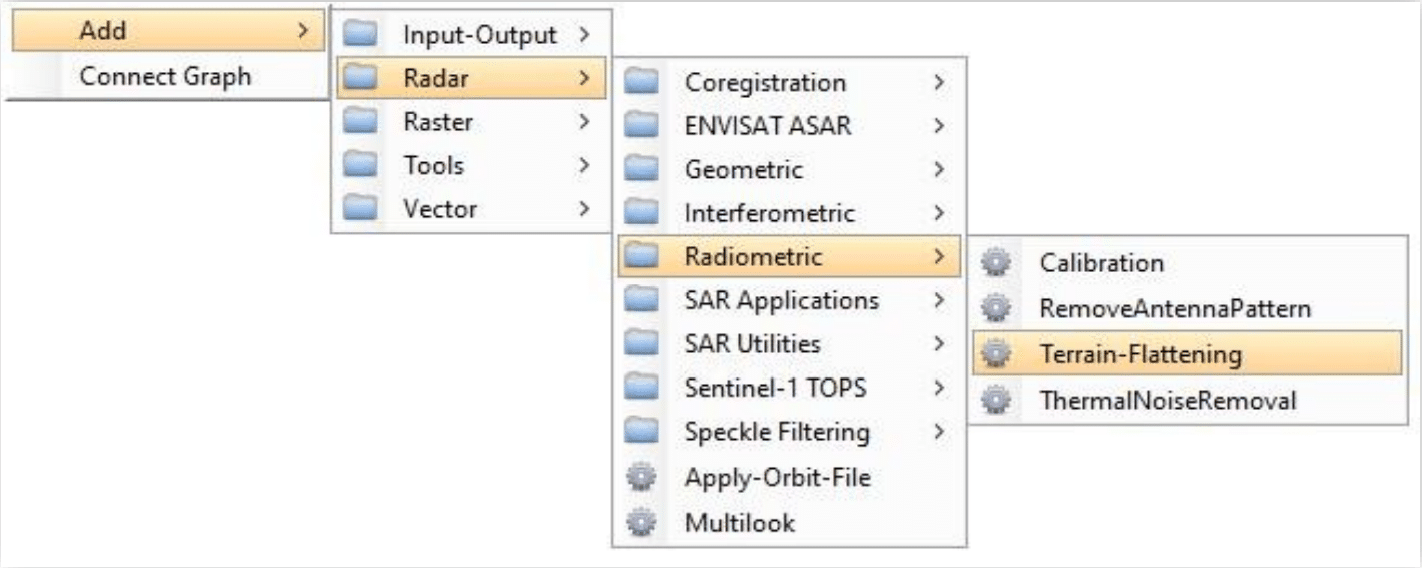
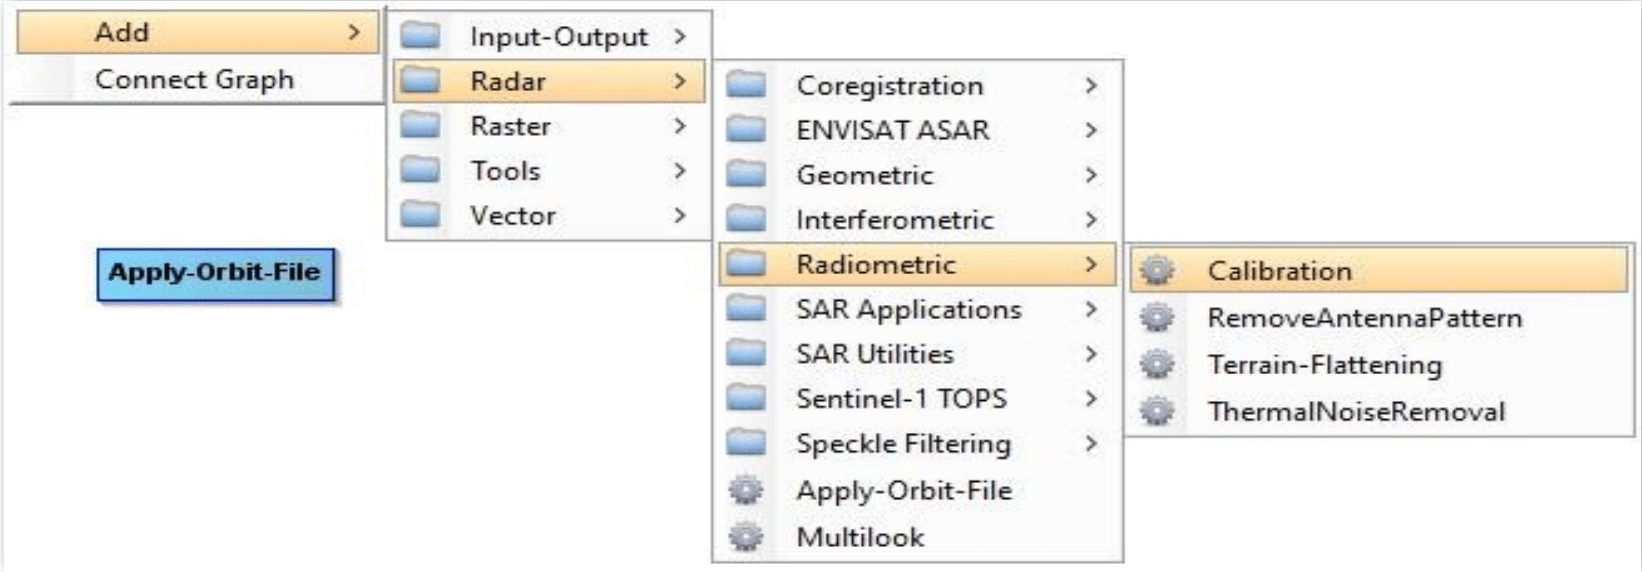
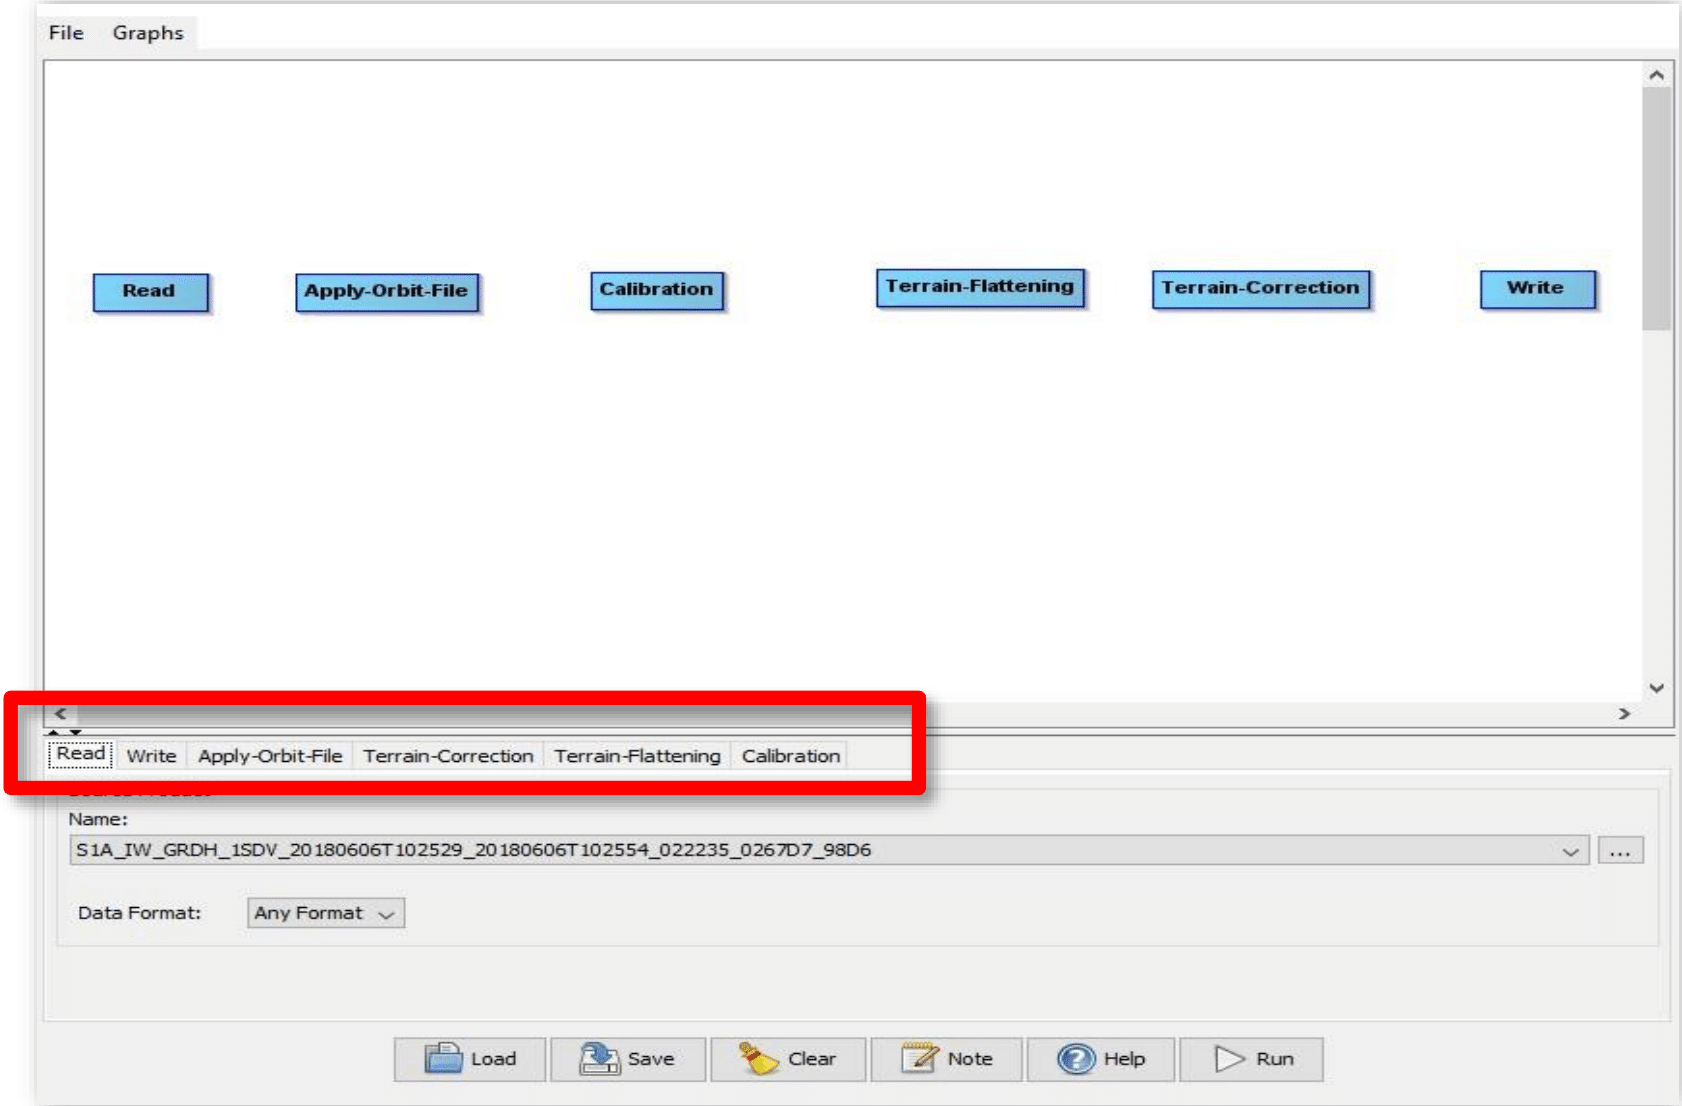
- In the Graph Builder window, there should now be a total of six blue boxes representing the operators, including the pre-existing Read and Write functions. There should be the same number of tabs below the work area. Using your mouse, drag to arrange the operators in this order: Read, Apply-Orbit-File, Calibration, TerrainFlattening, Terrain-Correction, Write.
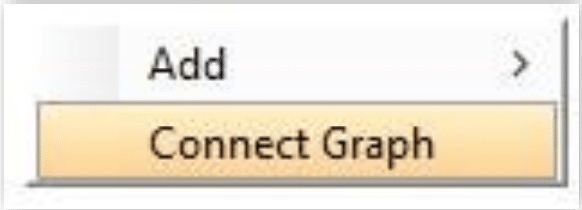
- Connect the operators by right-clicking the work area and selecting Connect Graph. Connecting the graph may take a moment while the toolbox computes the output/input band formats of each operator.
- The operator tabs under the work area will be listed in the order you added the operator, not the connected workflow order. Click on the Write tab and under Directory, set the output directory for intermediary files and the final product.
- Select the Apply-Orbit-File tab below the work area and check the Do not fail box.
Note: If the product is less than 20 days old, a precise orbit file may not be available yet. When performing a batch process with multiple products, this option allows the chain to continue if one of the products doesn’t have a precise orbit file yet.
- Select the Calibration tab. Unselect the Output sigma0 band box and select the Output beta0 band box. Beta0 calibration is necessary for the Terrain Flattening step.
- Select the Terrain-Flattening tab.
- Select an appropriate DEM type. Note that the default SRTM DEM is not available for areas above 60° north or 56° south. Our sample product is located in the East African rift zone so the default SRTM 1sec HGT will be suitable. If you plan on conducting a batch process, select a DEM that will be available for every product.
- Make sure the source bands listed are prefixed with Beta0.
- Leave the rest of the default tab settings unchanged.
- Select the Terrain-Correction tab.
- In the Digital Elevation Model option, select SRTM 1sec HGT, the same DEM used in the Terrain Flattening step.
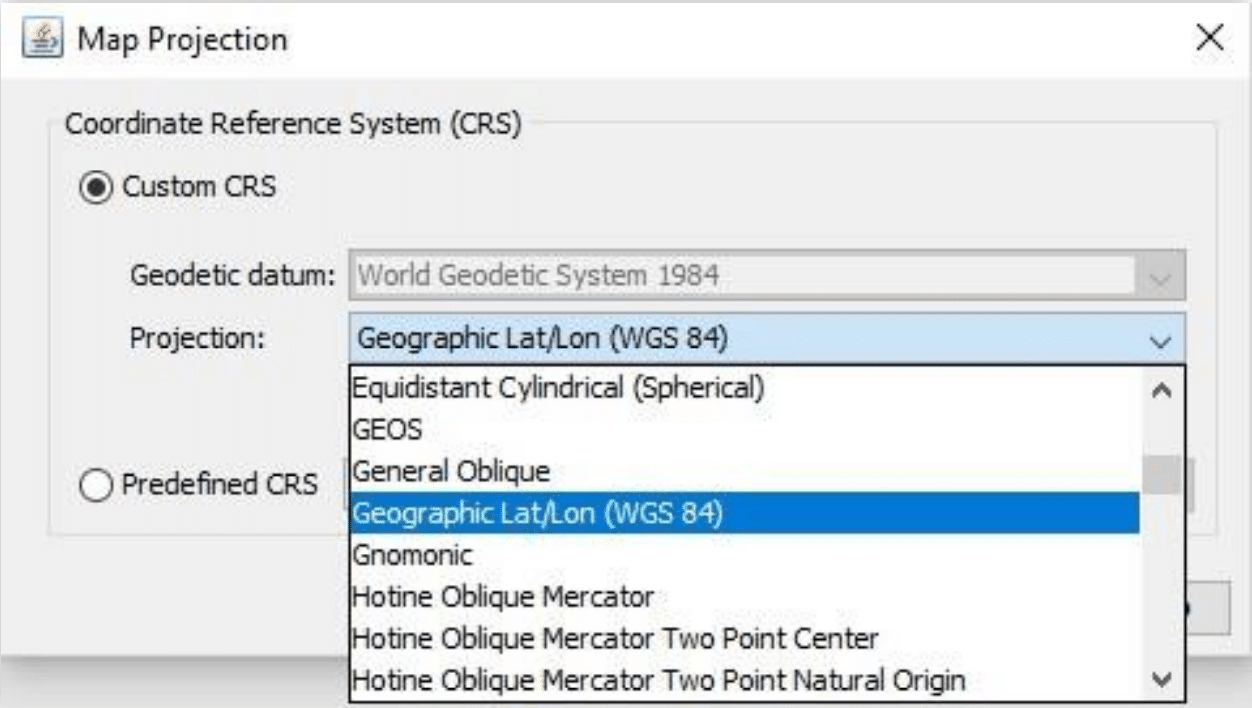
- Make sure the Map Projection is set to WGS84. In the Map Projection selection menu, this will appear as Geographic Lat/Lon (WGS 84).
- Make sure the source bands listed are prefixed with Gamma0.
- Leave the rest of the default tab settings unchanged.
- The graph is now complete and ready to be saved and run. Click the Save button at the bottom of the Graph Builder window. Select an appropriate name and path. Your graph will be saved as an Extensible Markup Language (XML) file with the file extension .xml.
- Select the Terrain-Correction tab.
Run the Graph
- With the Graph Builder window still open, click Run to process the RTC image for the single product open in the Sentinel-1 Toolbox Product Explorer window.
- Batch processing multiple files:
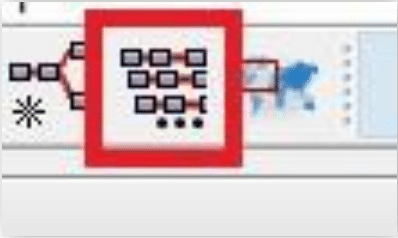
- To use the graph to process multiple products, click the Batch Processing tool icon in the top menu to open a Batch Processing window.
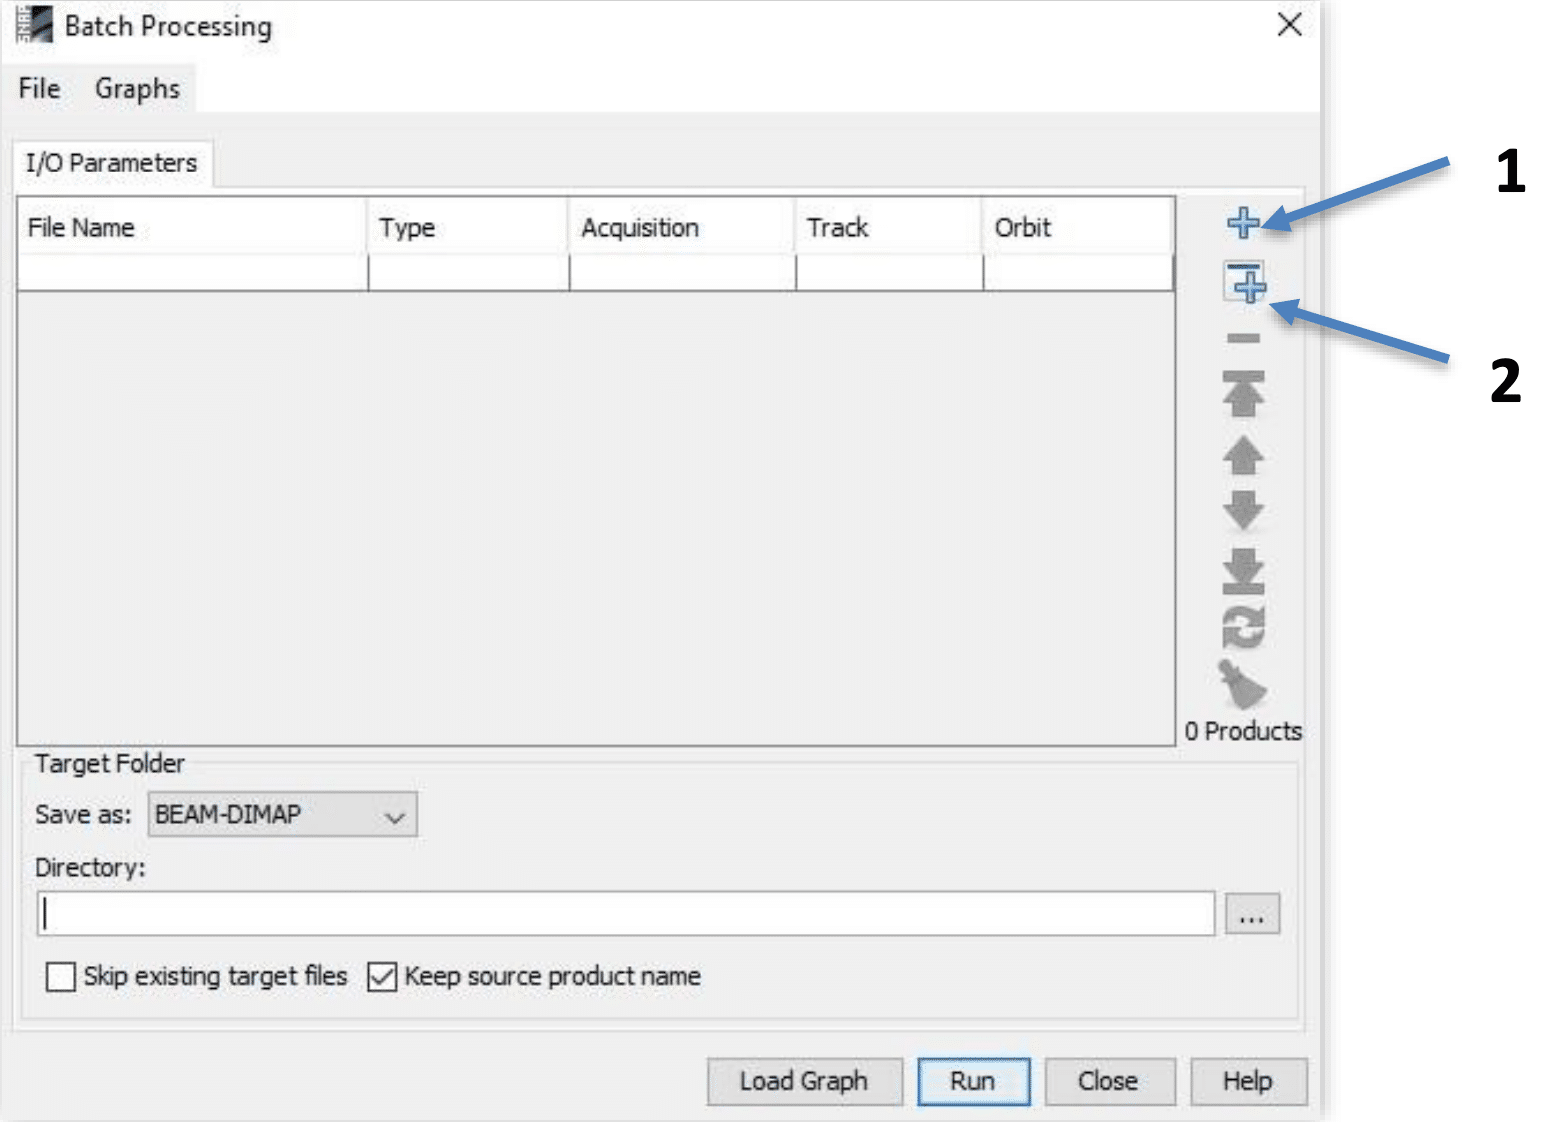
- To add files to the Batch Processing window, use the plus icon (1) in the upper right to navigate to where the files are located and select them. Then click OK.
- Hint: Press and hold the Ctrl (Windows) or Command (Mac) key to select multiple files.
- If you have files already open in the Sentinel-1 Toolbox Product Explorer window, the plus icon (2) will add all the products in the window.
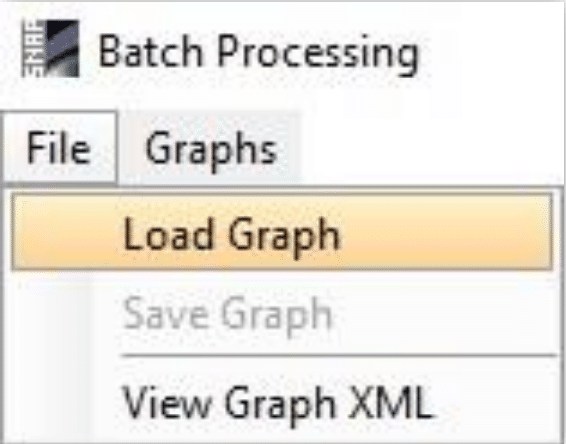
- At the top of the Batch Processing window, navigate to File > Load Graph. Navigate to the directory you saved the RTC graph in and select the corresponding .xml file.
Note: Clicking the Load Graph button in the bottom of the window will also work to navigate to the graph xml file.
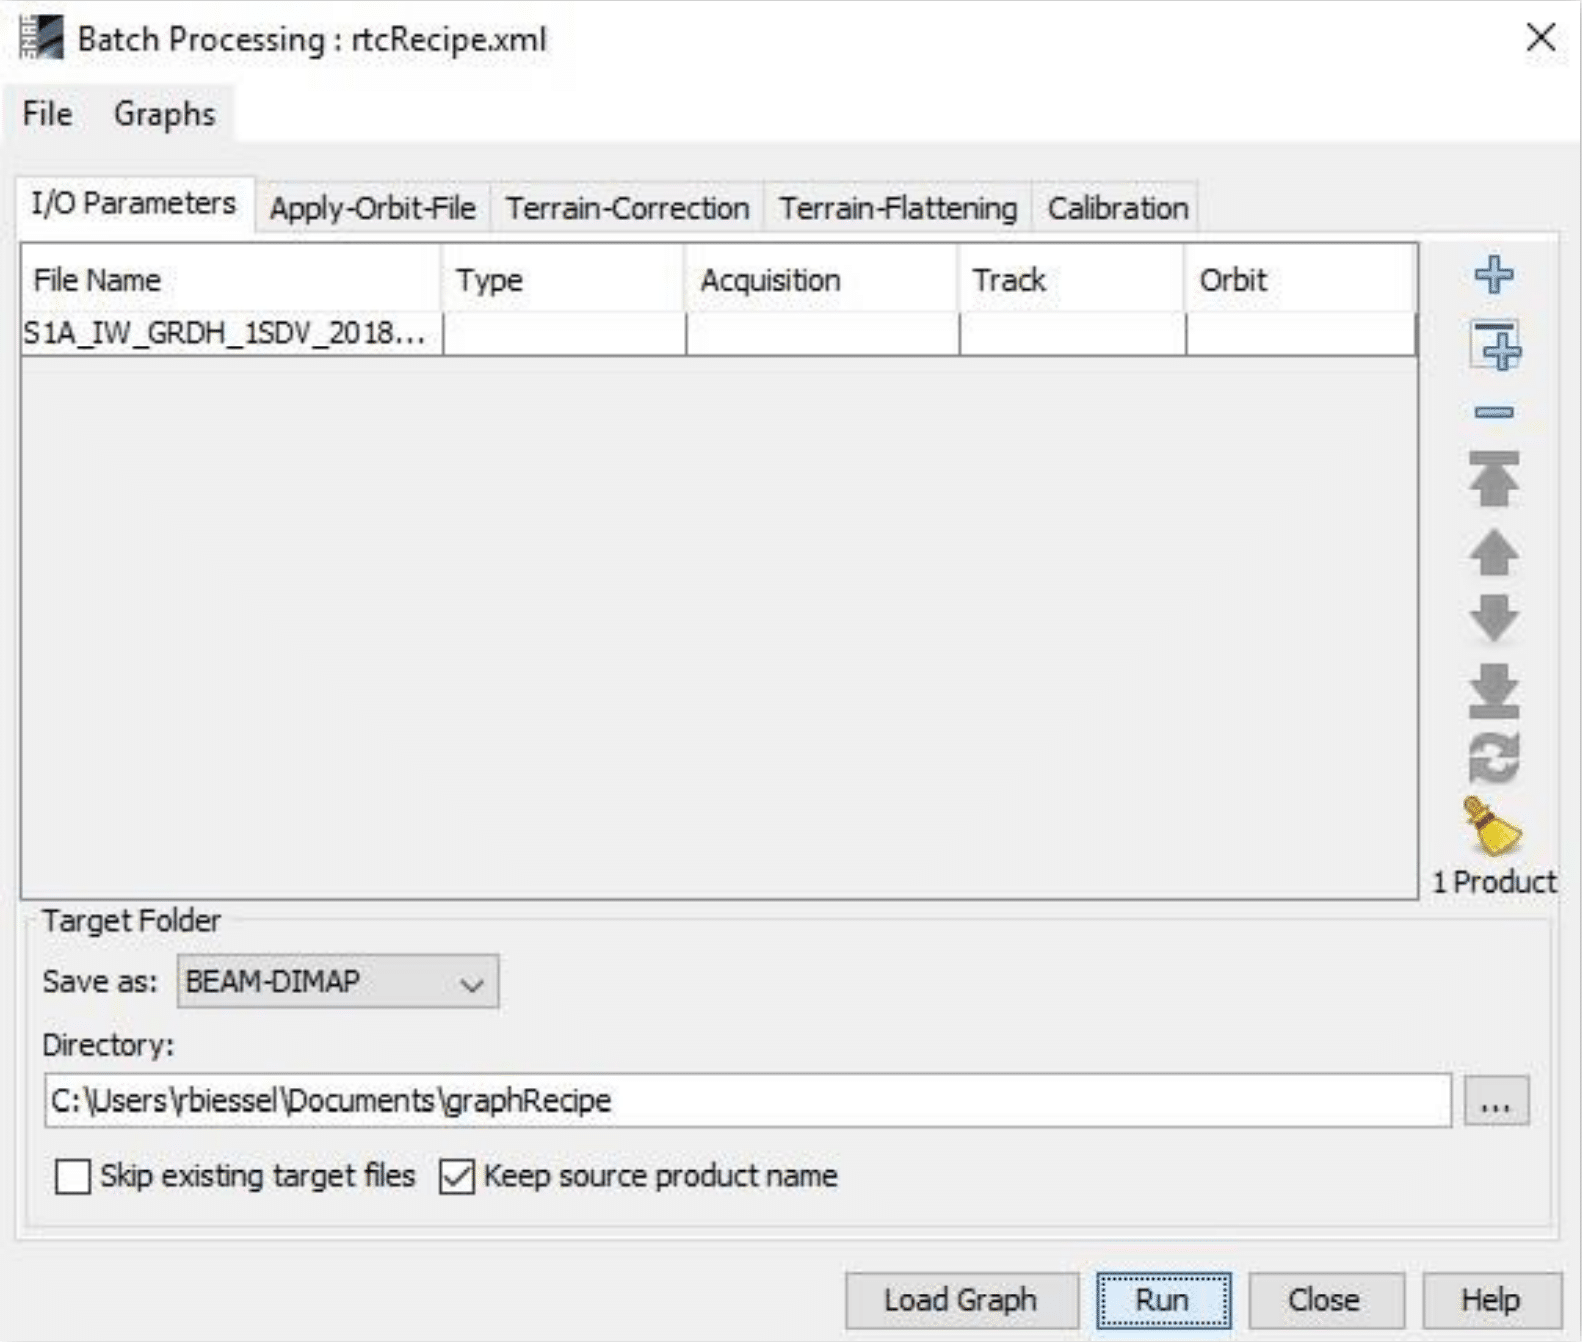
- Tabs will appear for each of the operators. The I/O Parameters tab takes the place of the Read and Write operators. Since we already set the correct parameters for each operator in the graph creation step, click Run.
Note: The progress bar will only show the completion of graph processing for each product. If you are only processing one product, no progress bar will appear.
- When the RTC is finished processing, a product will appear in the Product Explorer.
- The product from a graph executed in the Graph Builder will include the suffixes of each operator.
- The product from a graph executed in the Batch Processing window will not include suffixes.


