
Log-ratio image with OpenLayers Google Maps hybrid basemap Credit: ASF DAAC 2017; Includes Material ©JAXA/METI 2009, 2010.
Adapted from coursework developed by Franz J Meyer, Ph.D., Alaska Satellite Facility
● Easier (Windows, OS X)
Background
Due to their 24/7 observation capabilities, SAR data are relevant for a broad range of applications in environmental monitoring and emergency response. However, identifying changes in images with complex content is difficult, as the image content masks signatures of change. A simple and highly effective change detection approach is the so-called log-ratio scaling method. Based on a differential analysis of repeated images it has been shown to be effective in background suppression and change features enhancement.
Prerequisites
Materials list
- Windows, Mac, or Linux PC
- Two RTC images
Options to obtain images:
- Download and unzip Sample 1 and Sample 2
- Download and unzip RTC ALOS PALSAR images using Vertex
- Process RTC images using Sentinel data
- QGIS (version 2.18.12 was used in this recipe)
Note: To identify RTC images suitable for change detection, ensure images are from the same season. This is important for change detection operations as it avoids seasonal changes and focuses on true environmental changes in a change detection analysis.
Steps
Load Data
- Open QGIS
- Import two RTC images into QGIS
- Click on the Add Raster icon to open your image
- Browse to the directory of your RTC images
- Select the polarization of your choosing (e.g., HH)
- Select multiple images by holding the Ctrl or Shift button on your keyboard and clicking OK
Calculate the Log-Ratio Image
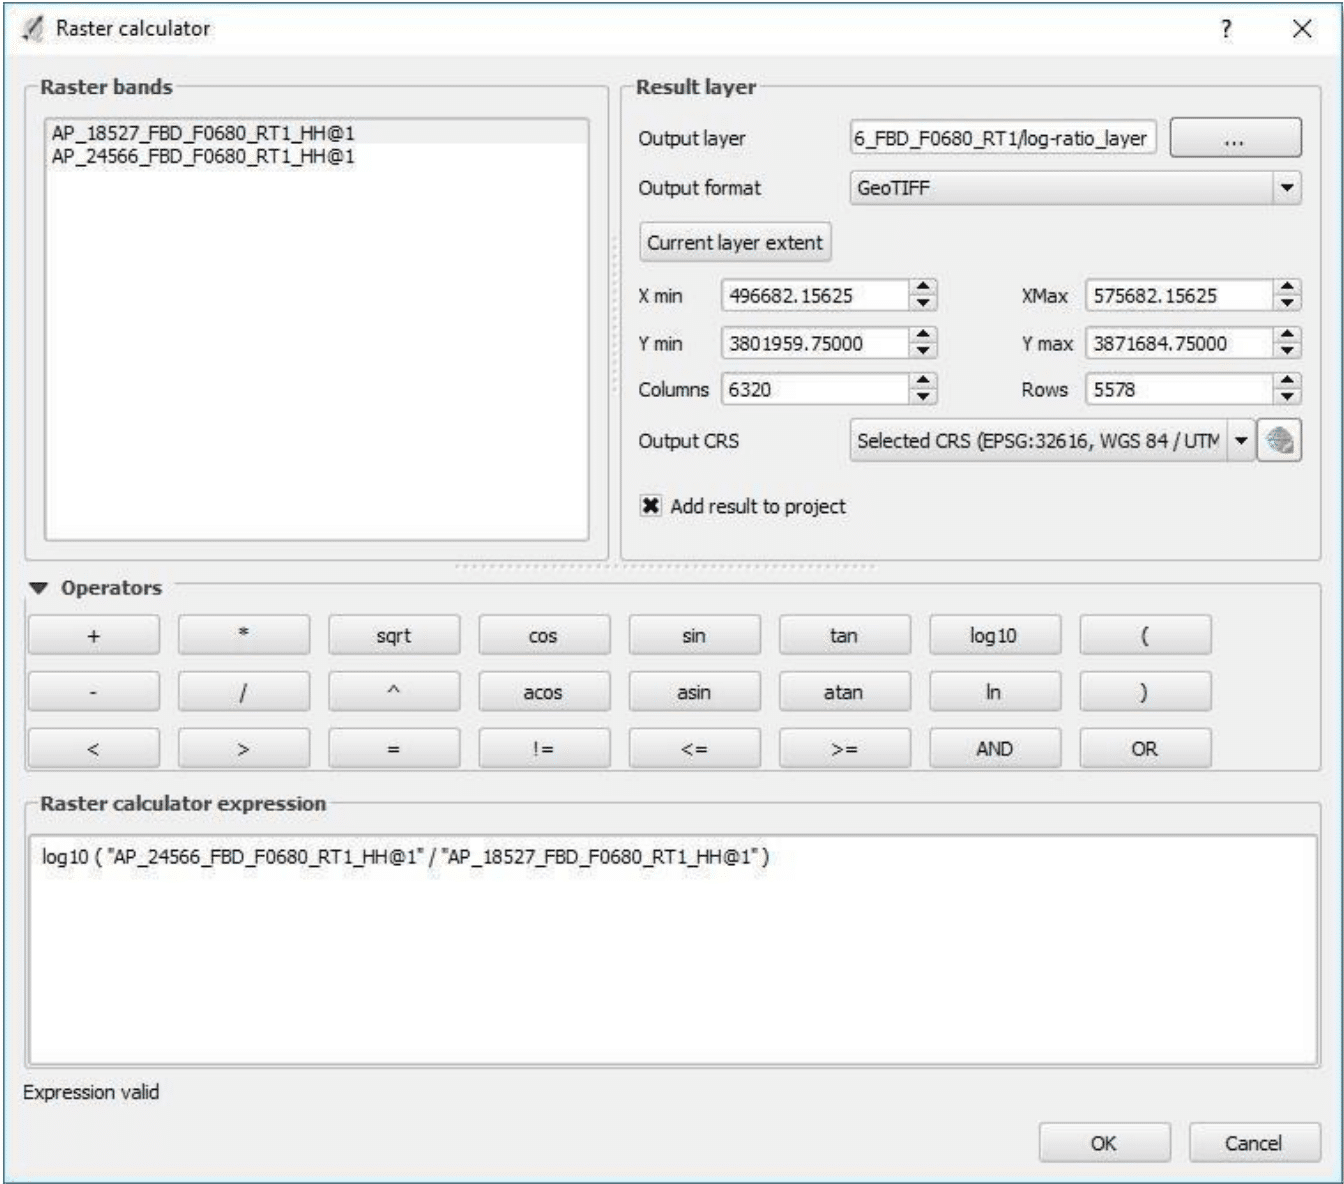
- Open the Raster Calculator
- In the top menu, navigate to Raster > Raster Calculator
- Construct the following expression:
- Open the Raster Calculator
Log10 (“newer image”/”older image”)
Note: The newer image has a larger orbit number; e.g., 24566 is newer than 18527. Double-click on the filename to add to the expression.
- Set the Output Layer to a filename and directory of your choice (e.g., “log-ratio_layer.tif”)
- Click OK to calculate the log-ratio image
- With the Add result to project checkbox, the result layer will automatically be added to the legend area and can be visualized
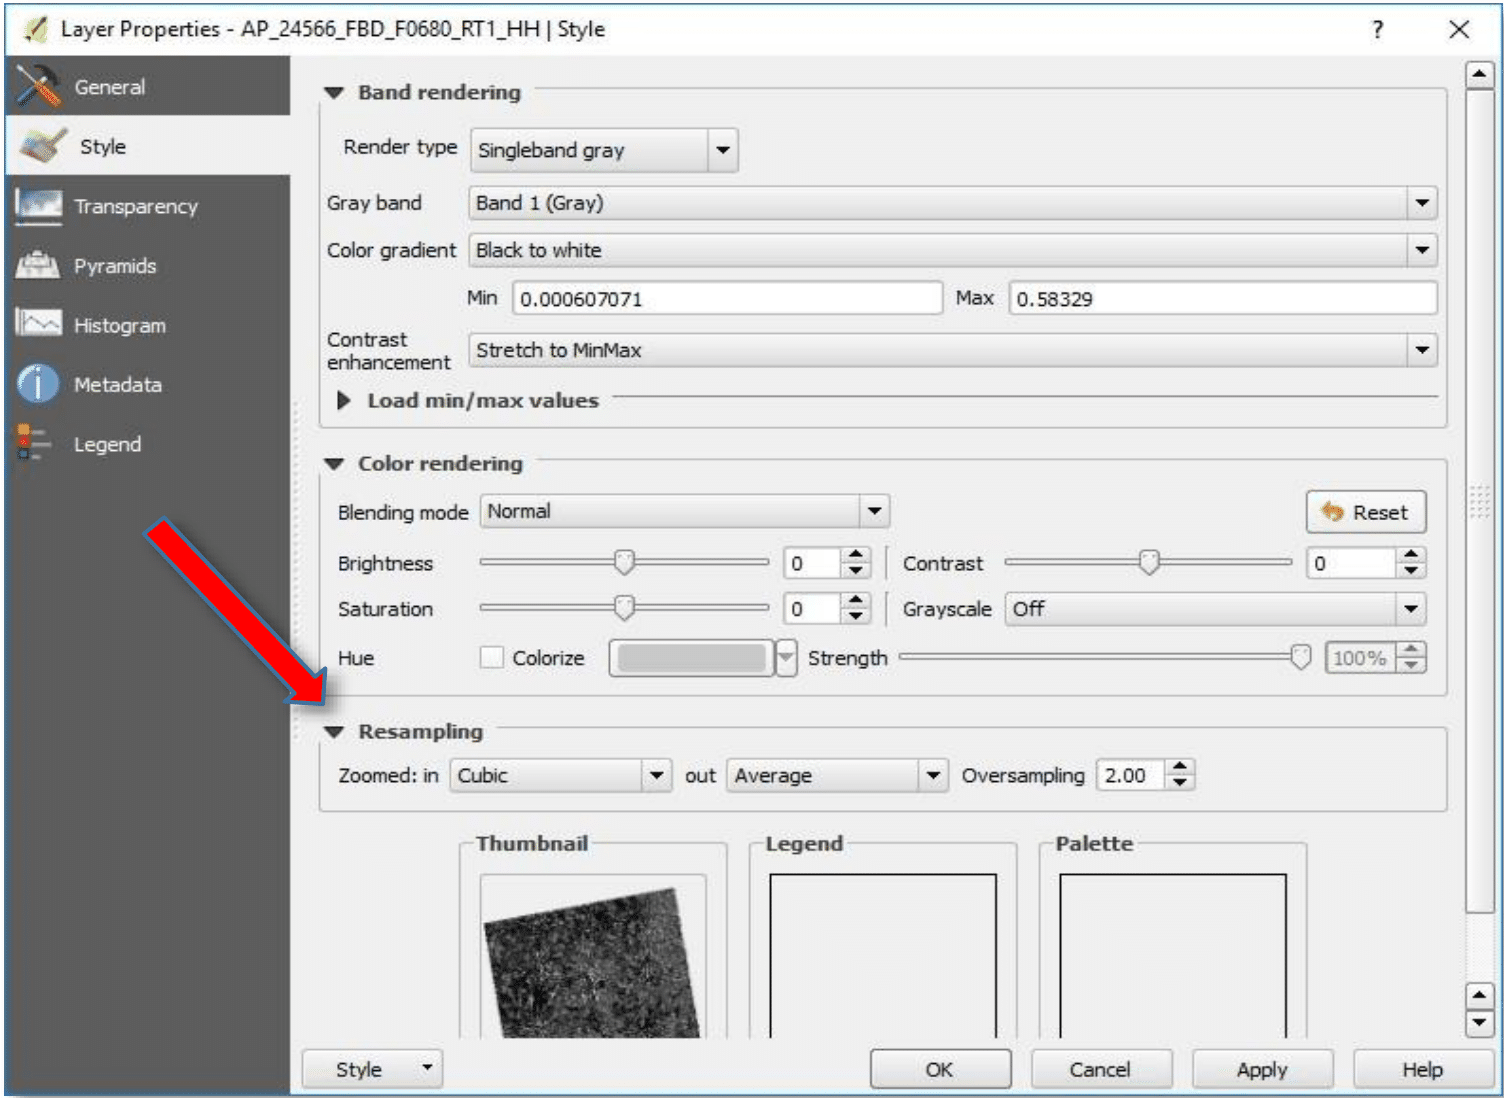
- To improve visualization at all spatial scales, apply a few changes to the image properties:
- Right-click on the image in the Layers Panel and select Properties
- In the Layer Properties window, click on Style
- Change the resampling method for Zoomed: in to Cubic, and Zoomed: out to Average
- Click OK
Optional — Add a base layer to compare image features to known landmarks
- Load the OpenLayers Plugin into your QGIS system via the Plugins > Manage and Install Plugins… item in the menu bar at the top of the QGIS interface.
- Open a base layer by using the top menu, Web > OpenLayers plugin

Note: The base layer used in the Raster Calculator dialog can be found in Web > OpenLayers plugin > Google Maps > Google Hybrid.
- In the Layers Panel in the lower-left corner, drag and drop the base layer so that it is below the log-ratio layer.
Resulting Image and Analysis
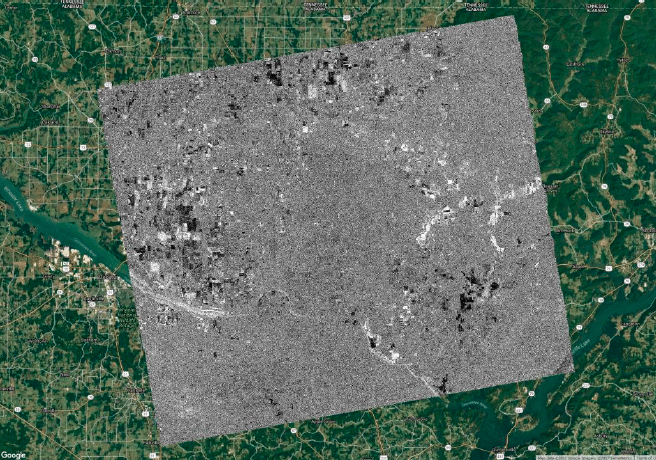
The resulting log-ratio image over Huntsville, Alabama was created from a pair of images acquired on 7/17/2009 and 9/04/2010, approximately one year apart. As the data are seasonally coordinated, differences between the images should largely be due to environmental changes between the image acquisition times, such as urban development, changes in river flow, or differences in agricultural activity.
It can be seen that most of the original image content (city of Huntsville, hills and vegetation structures near town, etc.) was effectively suppressed from the image. In the log-ratio image, unchanged features have intermediate gray tones (gray value around zero) while change features are either bright white or dark black. Black features indicate areas where radar brightness decreased while in white areas, the brightness has increased.
Other Applications
Illegal Logging/Deforestation
Background
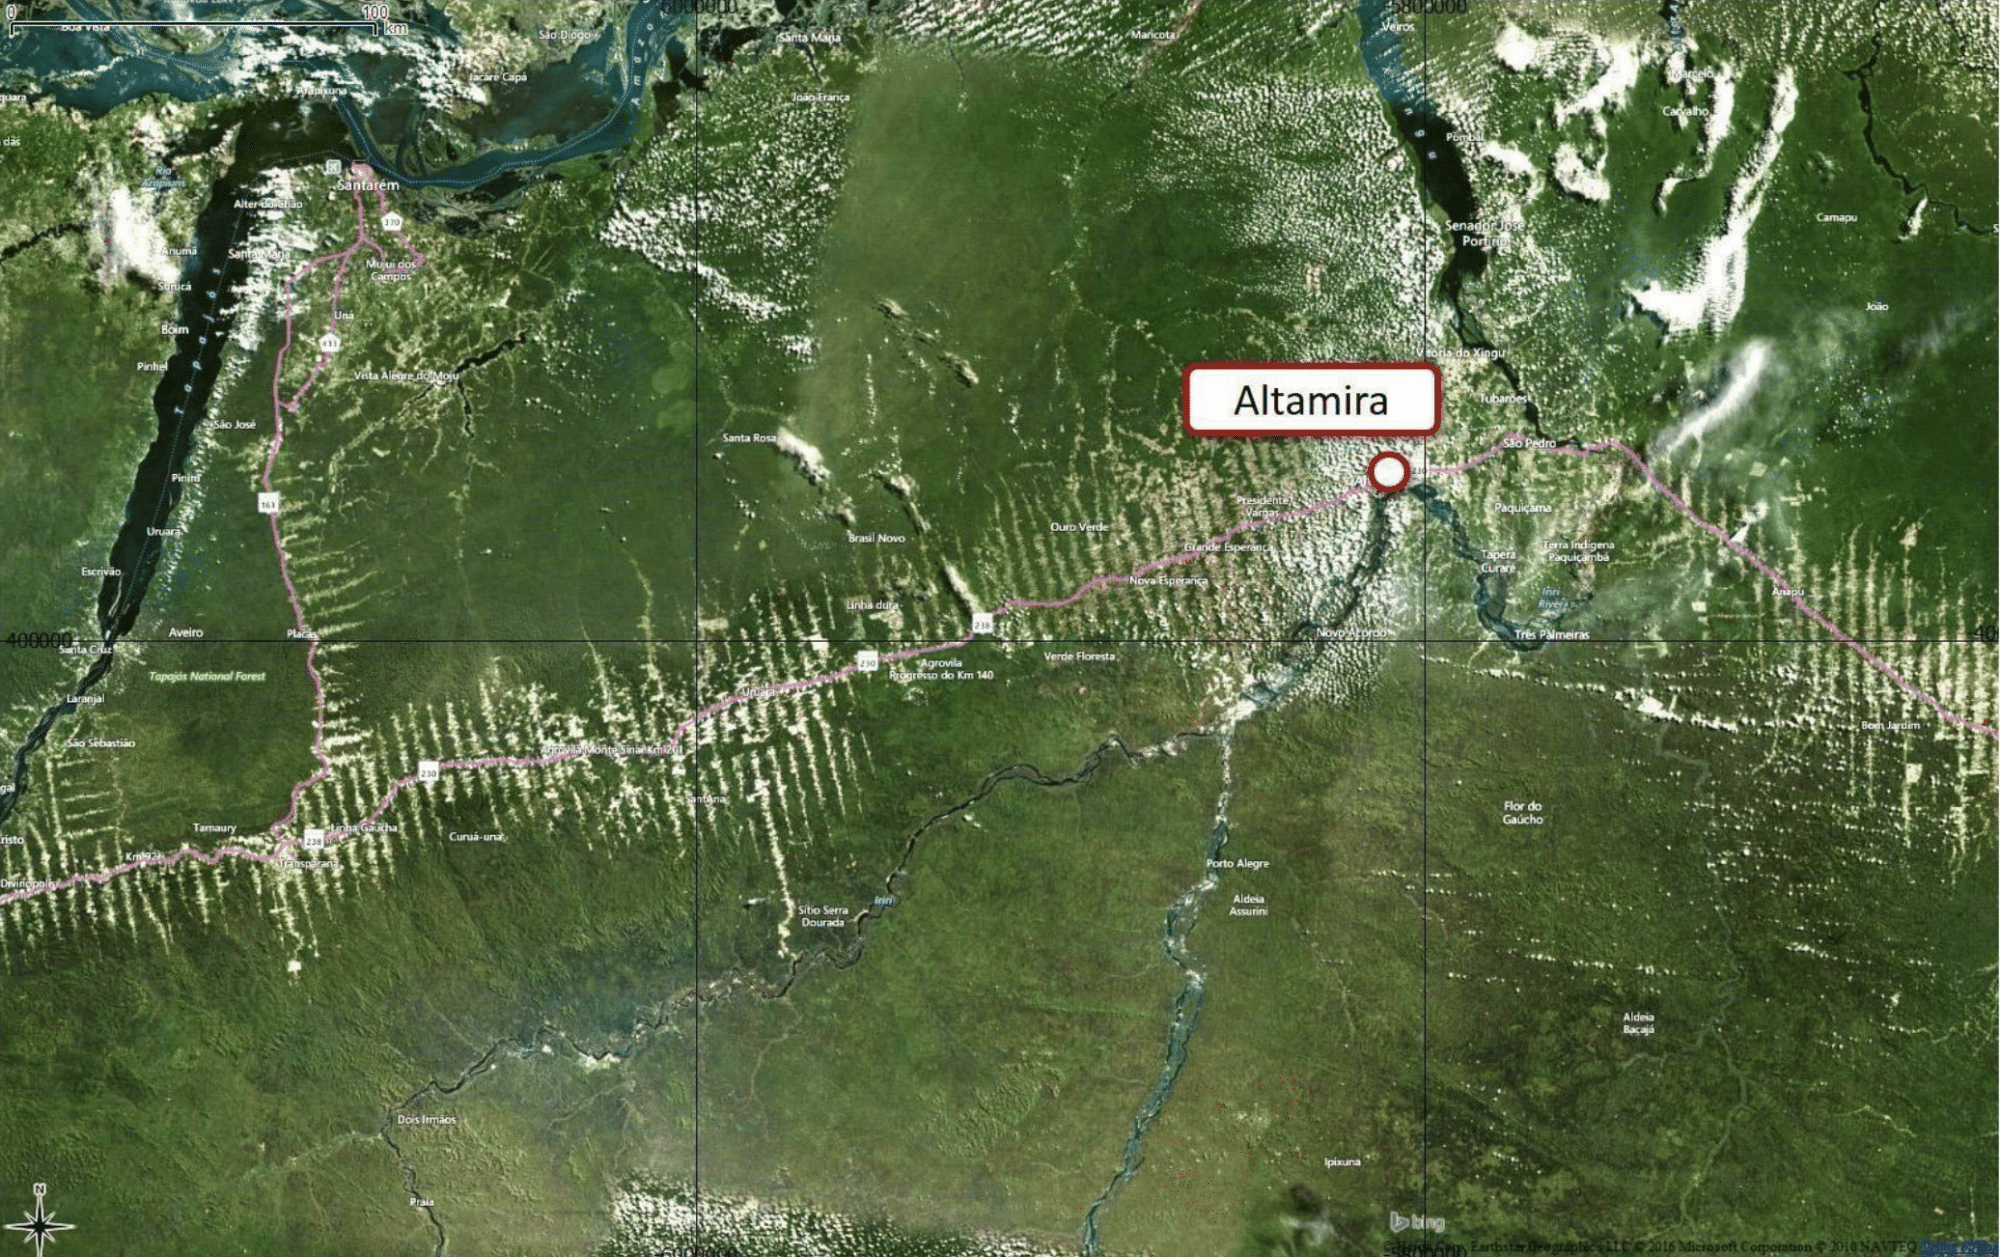
The region near Altamira, Brazil, is one of the most active logging regions of the Amazon rainforest. While some of the logging activities in this area are legitimate, illegal logging operations have flourished over the last decade. Existing logging roads can be clearly identified in optical satellite images, such as those used by Bing Maps©. However, frequent rain and cloud cover make change detection based on optical remote sensing data impractical.
Steps
Select and download High-Res Terrain-Corrected ALOS PALSAR repeated images over the logging areas near the Brazilian city of Altamira. Target similar seasons. Due to the evergreen vegetation in this tropical area, there is no preference for which season you choose. Use the Log-Ratio Scaling method as outlined in this recipe’s Steps section.
Note: To use Sentinel-1 data, please use high-res GRD data. You must first extract, project and scale by byte before the data can be used in the GIS environment.