Alaska Satellite Facility - Distributed Active Archive Center

Table of contents

    Add a header to begin generating the table of contents

    Sentinel-1A and Sentinel-1B satellites carry C-band SAR instruments to provide an all-weather, day-and-night supply of imagery of Earth’s entire surface every 6 days.


    Coverage Maps

    Instrument

    Launches:

    • Sentinel-1B: Soyuz rocket, launched 25 April 2016, from Kourou, French Guiana
    • Sentinel-1A: Soyuz rocket, launched 3 April 2014, from Kourou, French Guiana

    Orbit: Polar, sun-synchronous at an altitude of 693 km

    Revisit time: Six days with two-satellite constellation of Sentinel-1A and 1B. Before 1B launched, revisit time for Sentinel-1A alone was 12 days.

    Instrument: C-band synthetic aperture radar (SAR) at 5.405 GHz

    Operational Modes
    • Interferometric wide-swath (IW) at 250 km and 5×20 m resolution, using TOPSAR
    • Wave (WV) images of 20×20 km and 5×5 m resolution (at 100 km intervals)
    • Stripmap (SM) at 80 km swath and 5×5 m resolution
    • Extra wide swath (EW) of 400 km and 20×40 m resolution, using TOPSAR
    Polarization
    • Supports operation in single polarization (HH or VV) and dual polarization (HH+HV or VV+VH)
    • Polarization implemented through one transmit chain (switchable to H or V) and two parallel receive chains for H and V polarization
    • SM, IW and EW are available in single (HH or VV) or dual polarization (HH+HV or VV+VH)
    • WV is single polarization only (HH or VV)

    Receiving stations: SAR data: Svalbard, Norway; Matera, Italy; Maspalomas, Spain; and via laser link through EDRS (European Data Relay System)

    Telemetry, tracking and command: via Kiruna, Sweden

    Main applications: Monitoring sea ice, oil spills, marine winds and waves, land-use change, land deformation, and to respond to emergencies such as floods and earthquakes

    Mission: Developed, operated, and managed by various ESA establishments

    Life: Minimum of seven years

    Satellites: 2.8 m long, 2.5 m wide, 4 m high with 2×10 m-long solar arrays and a 12 m-long radar antenna

    Mass: 2300 kg (including 130 kg fuel)

    Funding: ESA Member States and the European Union Prime contractors: Thales Alenia Space, Italy, for the satellite; Airbus Defence and Space, Germany, for the SAR instrument

    Content on ASF’s Sentinel web pages is adapted from the European Space Agency (ESA) Sentinel website.

    SAR Modes

    Links in the table below open to ESA’s website for more information.

    SAR ModeInterferometric Wide Swath (IW)Extra Wide Swath (EW)
    DetailsAcquired with TOPSAR. Default mode over land; 250km swath width; 5m-x-20m ground resolution.Acquired with TOPSAR using 5 sub-swaths instead of 3, resulting in lower resolution (20m-x-40m). Intended for maritime, ice, and polar-zone services requiring wide coverage and short revisit times.

    Image Quality

    Users of Sentinel data may see quality issues similar to those below. Users are encouraged to submit examples of image-quality issues to [email protected].

    Browse images affected by map projection

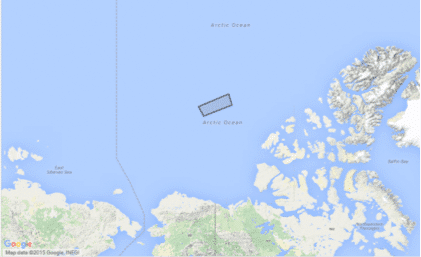
    When an image granule is located above 65° latitude, the browse image can appear to be oriented and shaped differently than its outline in Vertex. The browse image is a geocoded JPEG displayed in a polar stereo map projection at latitudes above 65° in either hemisphere. The Vertex map always displays a granule in a Mercator projection. The examples show a Vertex map outline of a granule in the Arctic Ocean and an associated browse image. The browse image also is an example of stepped ends.

    Granule MapAscending browse image

    Images from data close to the noise floor

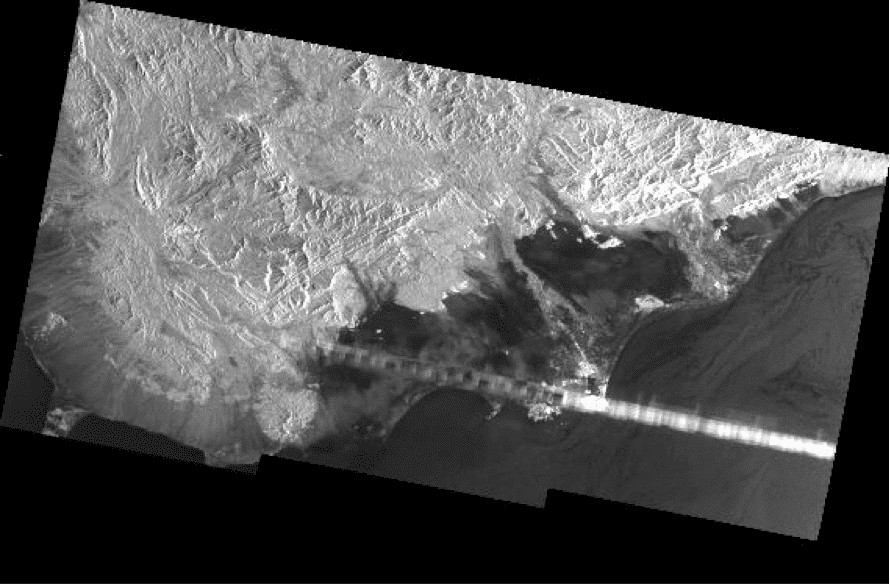
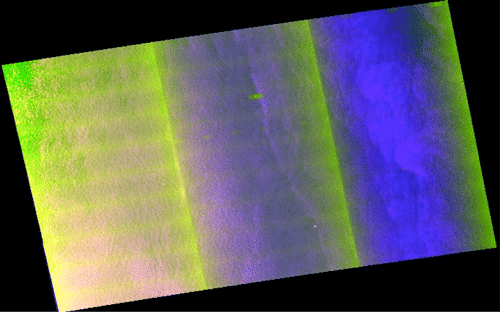
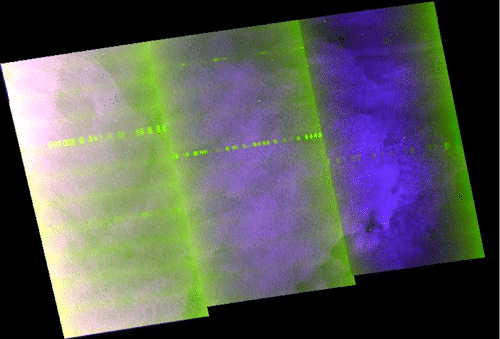
    Images that contain a great deal of noise have often been processed close to the noise floor (the data closest to the point where it is too noisy to be useful). The noise can look like repeating lines across an image, something like horizontal window blinds, as in the left image below. Those repeating lines are not the same as the bright spots in these images, which appear in the image below and to the right as a line of repeated bright spots or bursts. Those bright bursts are image anomalies that are not yet well understood. Also visible in these images are beam seams (see the next section).

    Center processing anomalyProcessing anomalies

    Beam seams

    Beam seam anomaly

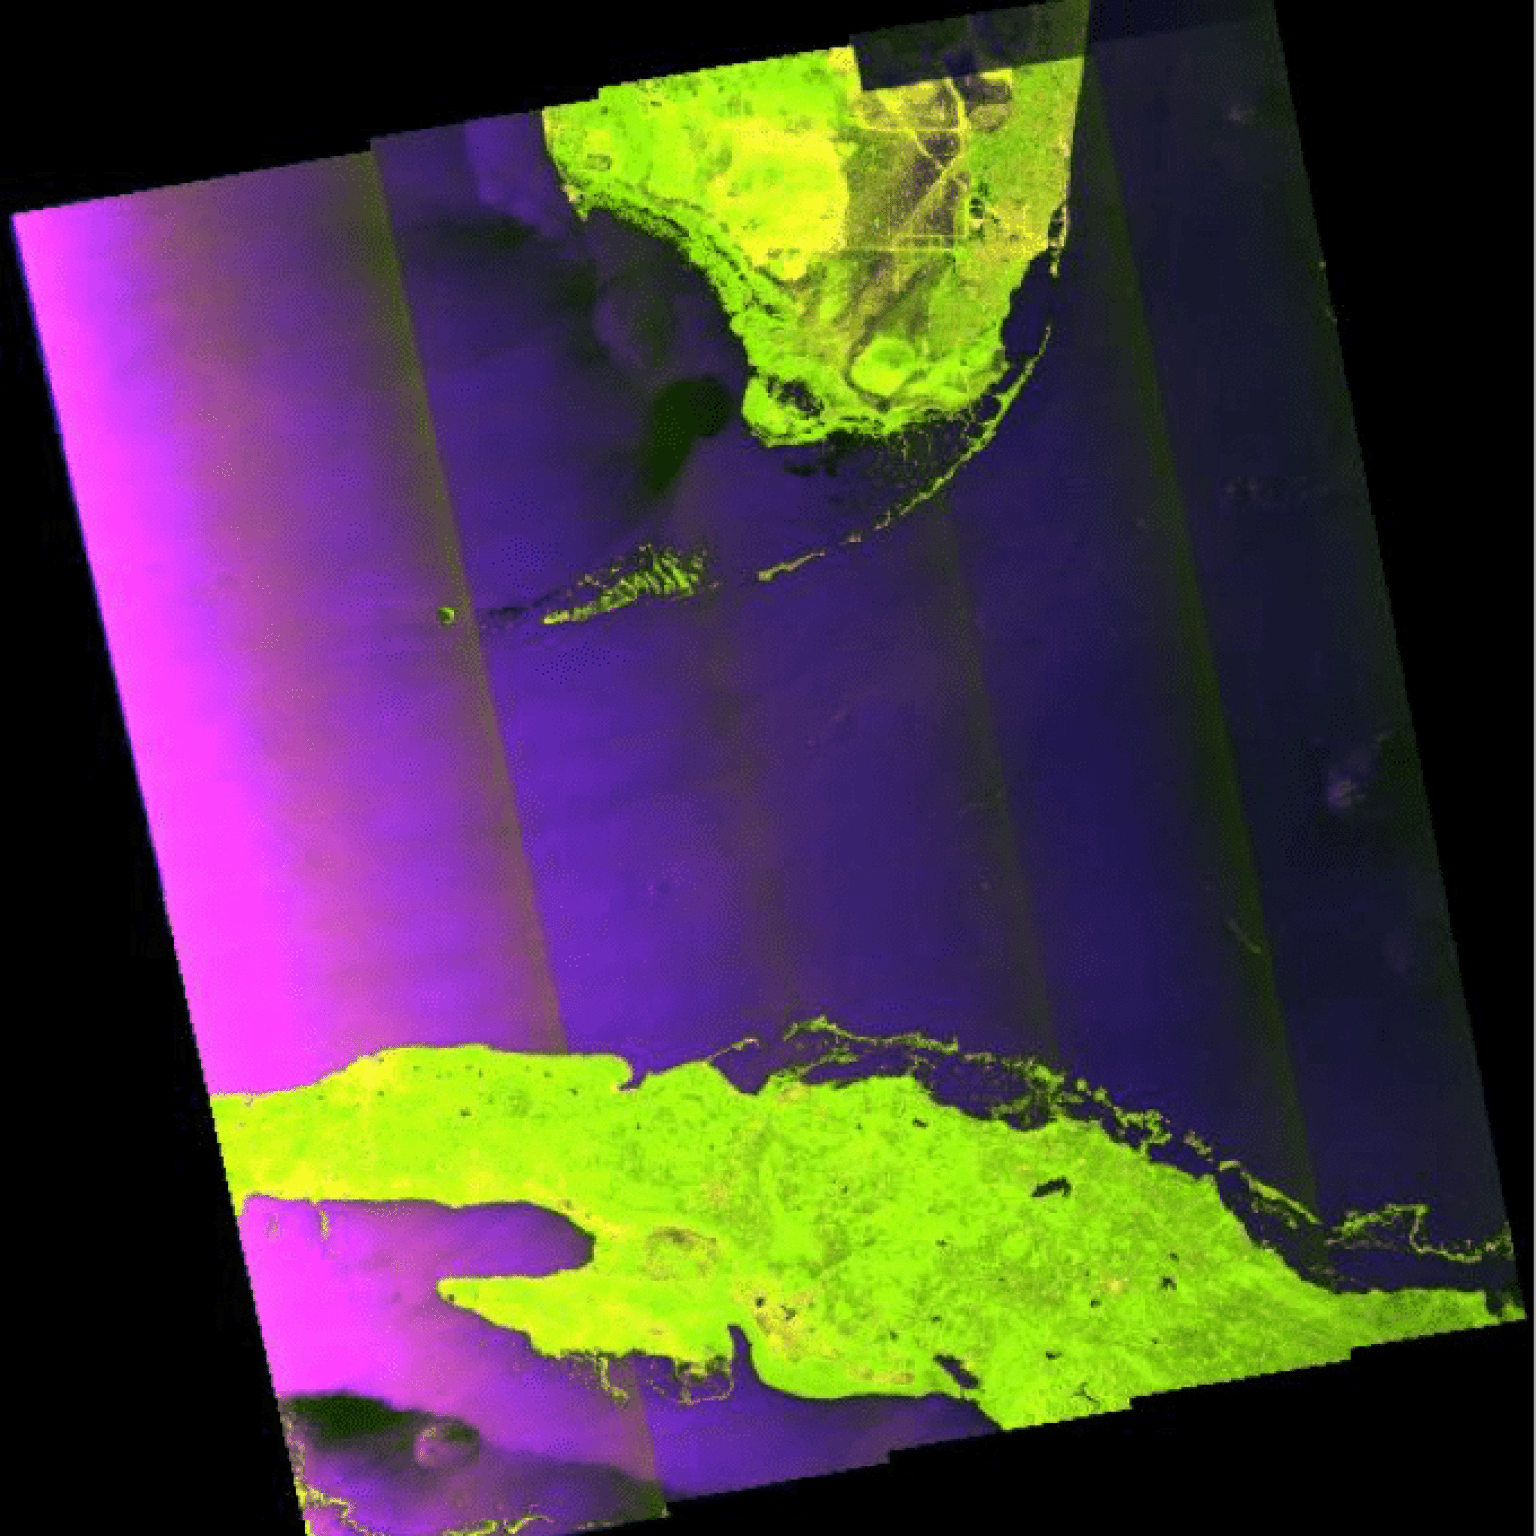
    When one image is made up of several beams, the seams can show, particularly in dark data. Beam seams are visible in many of the images on this page, including the one to the right.

    Offsets between channels

    Offset anomaly

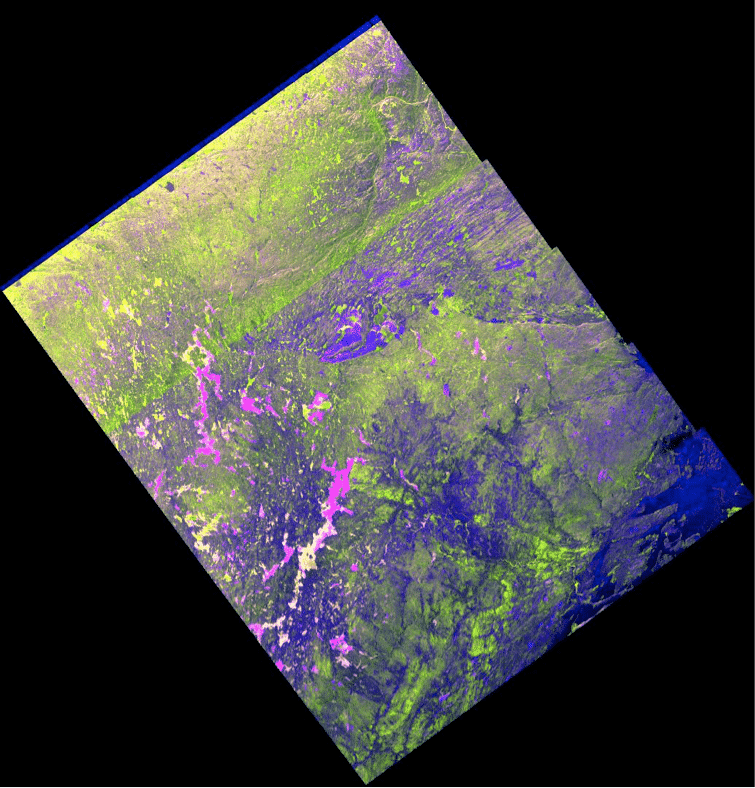
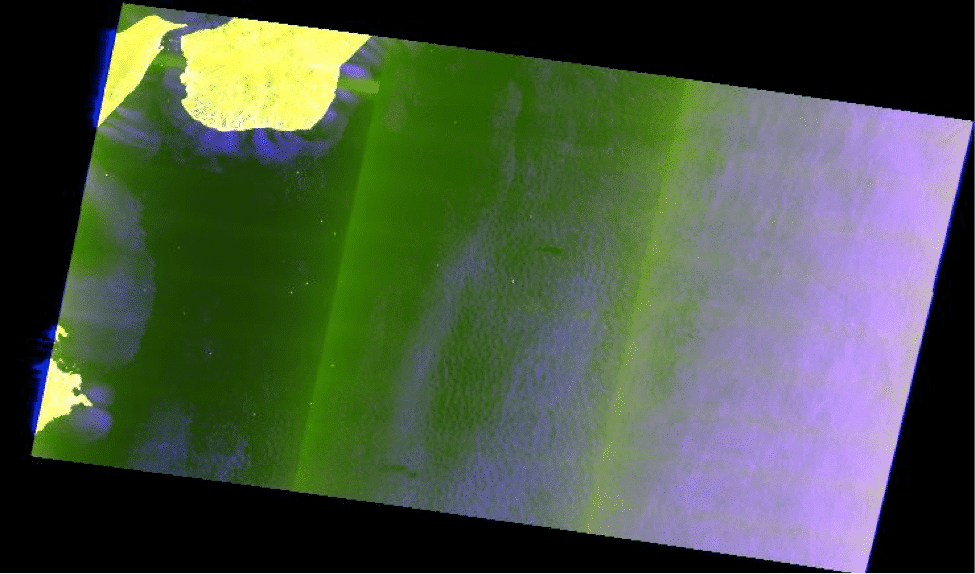
    Beams that seem to have noisy or missing data at one end, such as the dark blue edge at the top of the image, have been processed in one channel more than another (such as the HV or VH channels).
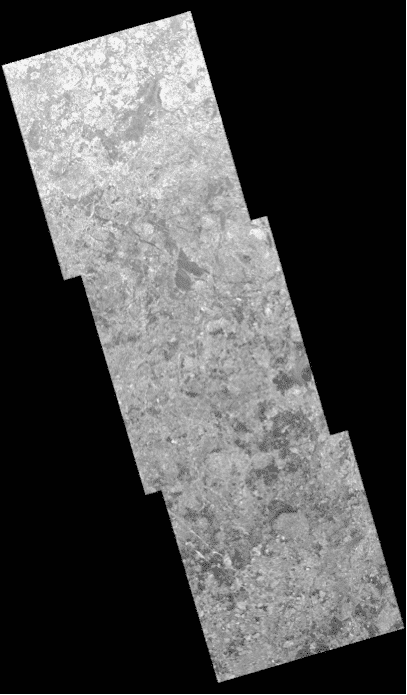
    Stepped edges

    Jagged edge anomaly

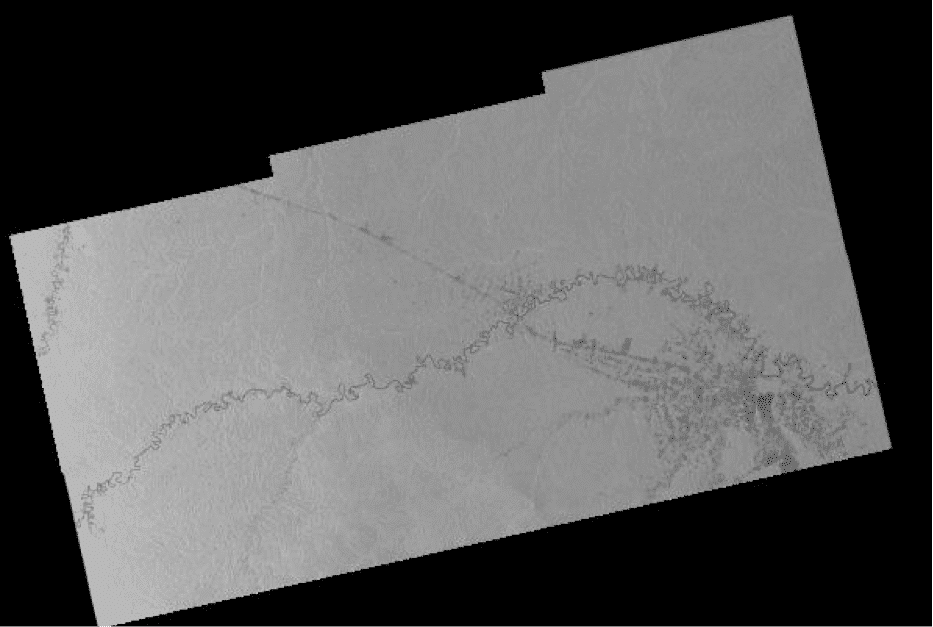
    Stepped ends, as in this image, are an artifact of the multi-beam scanning technology of TOPSAR and the way that ESA “slices” a data take into discrete, manageable units.

    Bright burst

    Bright bursts are processing anomalies that are not well understood. Bright bursts are in the upper left corner of the image below at left and in the light stripe across the image below right. Also visible in the image on the left are noise (window-blind effect), beam seams, and a bit of blue on the far left that may indicate an offset between channels.

    Bright burst of light in imageGrayscale image with blue parts

    Documents and Tools

    NameDescription
    Product Specification Document, ASF Defines the ISO-compliant XML metadata for ESA’s Sentinel-­1A data.
    Sentinel-1 SAR User Guide IntroductionHigh-level description of instrument modes and products. Also introduction to relevant application areas, information on data distribution, product formatting, and software tools available from ESA.
    Sentinel-1 Technical GuideCovers an in-depth description of the mission’s products and algorithms as well as details of the SAR instrument and its performance.
    Sentinel High Level Observation Plan, Issue 2, Revision 1Provides the top-level operations plan of the Sentinel missions, including space and ground segments.
    Sentinels POD Service File Format SpecificationsUseful for InSAR. Users who consult this document may also want Precision State Vectors, available from ASF from 3 September 2015. The product handbook describes the products generated as part of the provisioning of the Copernicus POD Service.
    Sentinel Document LibraryThe full document library is available on the ESA website.

    Sentinel-1 Tools

    NameDescription
    ESA Sentinel App, for iOS and AndroidPowerful visualization of Sentinel product availability. Track the satellites in real time over a 3D globe, see the last and next time they have been and will be over the user’s location, and more.
    HyP3-ISCE2HyP3-ISCE2 is a burst-based Python package for creating burst InSAR products using ASF’s burst SLC products. This Python package can be installed and run locally, or burst InSAR products can be requested through HyP3, ASF’s on-demand processing tool.