



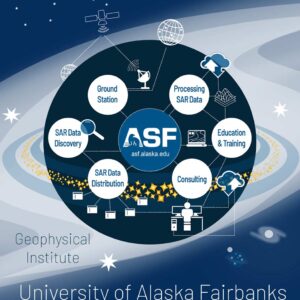
The ASF Distributed Active Archive Center (DAAC) specializes in synthetic aperture radar (SAR) data collection, processing, archiving, and distribution.



In this virtual exhibit, see how ASF, in partnership with NASA, supports polar-orbiting satellites and turns synthetic aperture radar (SAR) data into new ways of observing our changing planet.

This search supports advanced operators like AND, NOT & OR
ASF’s User Working Group brings together scientists who use synthetic aperture radar (SAR) data in their research. The group offers independent feedback on ASF’s data, tools, and services and to recommend new resources that could benefit the scientific community. Meet three scientists who use SAR data to explore and better understand our changing planet.
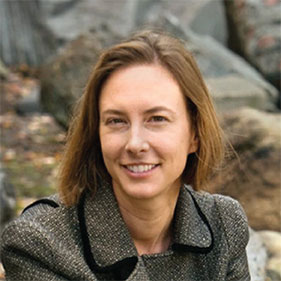
Cornell University, Department of Earth and Atmospheric Sciences
“I want to look at smaller magnitude signals and see how they change over time. How does that change over the seasons? How does the ground motion change when we stop pulling water out of a well or when there’s a lot of rain?”
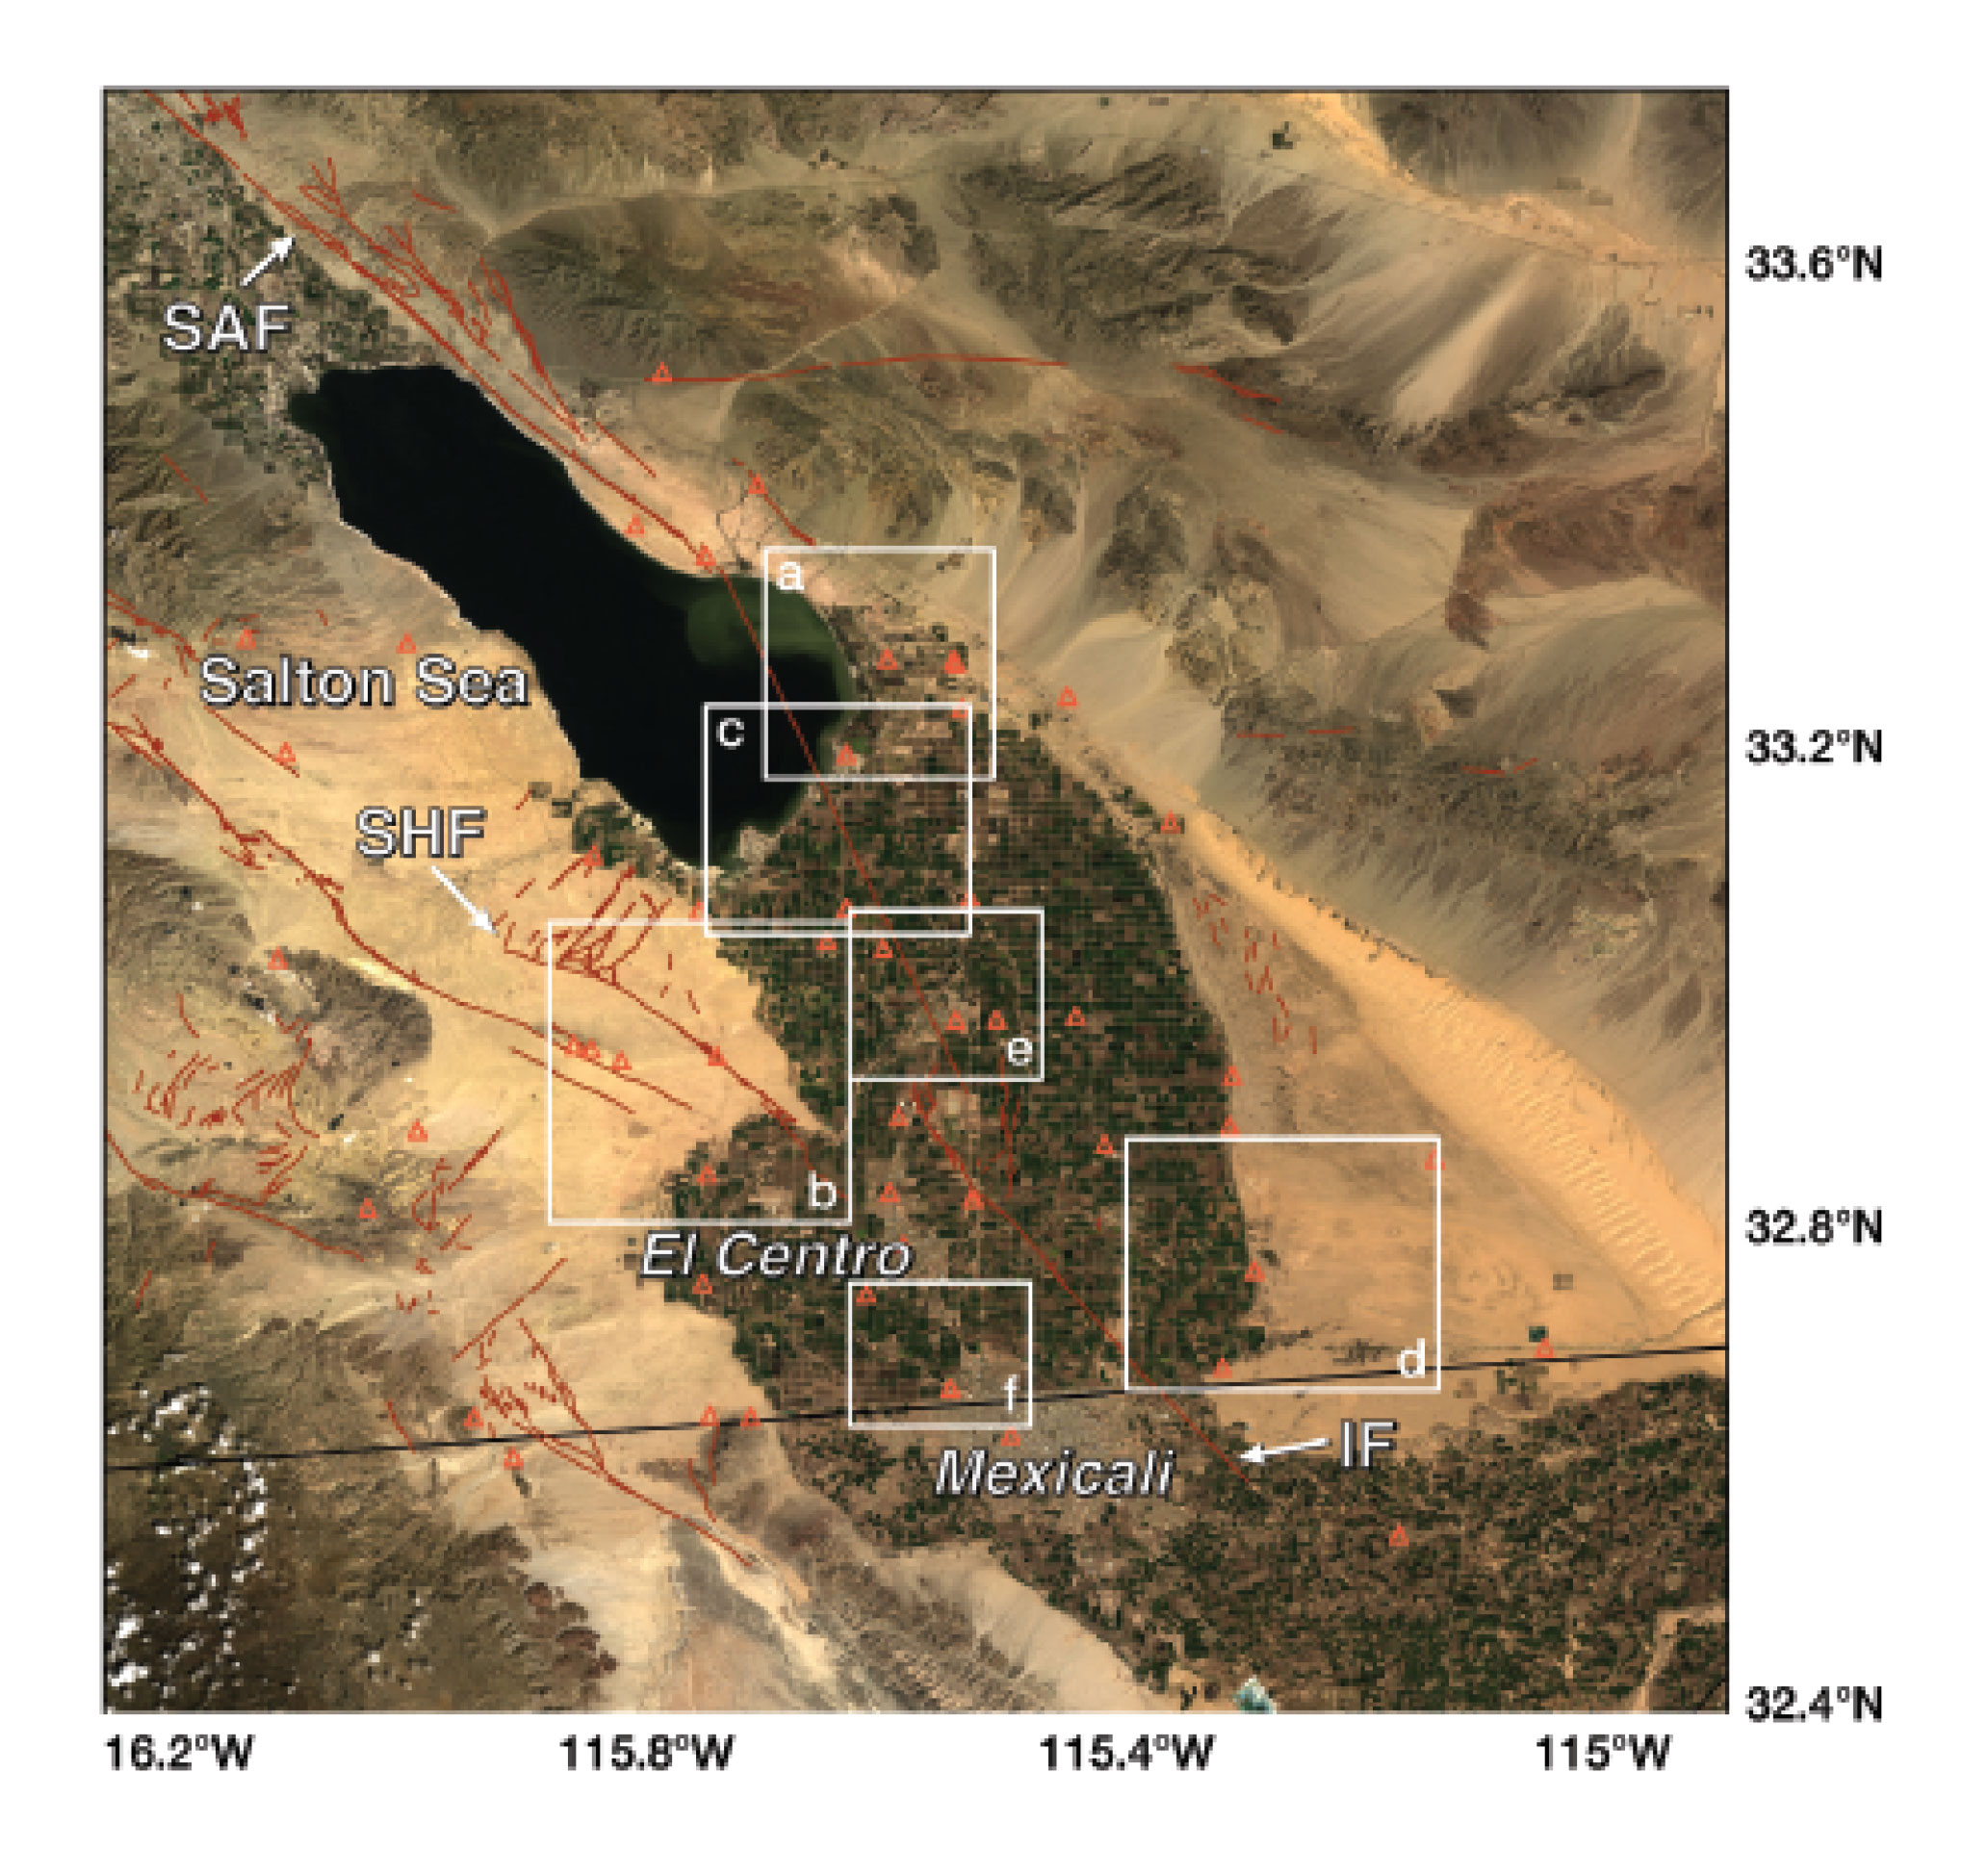
Initially, I saw myself as a “traditional” geologist who went into the field and hit rocks with a hammer. As time went on, I realized that the problems I was most interested in, like “Why do earthquakes occur?” couldn’t be answered with field measurements alone. This led to my interest in satellite-based observations, and as time went on, other signals, such as aquifer-related subsidence, became more interesting to me. Many students want to work on those problems since the connection to social problems is very direct. They enjoy the idea that what we observe and understand from space can help people decide how to manage water resources.
I graduated right around the time that InSAR (Interferometric Synthetic Aperture Radar) was taking off. My last undergraduate job was translating some of the existing SAR processing code, and this meant that I read every line. These days, I work with InSAR data in places with agricultural activity, where farmers need to pull a lot of water out of the ground to water their crops. With InSAR, we can see the ground subsiding in those areas. However, since the plants and the deformation signal are in the same spot, we don’t JUST see the ground moving. We see contributions to the data from changes in soil moisture and vegetation.
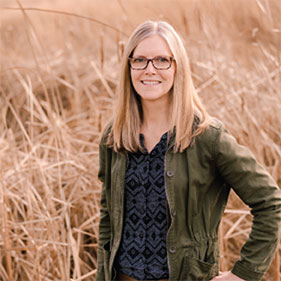
Michigan Technological University, Michigan Tech Research Institute
“Originally ESA (European Space Agency) didn’t want to save all the Sentinel-1 data, but ASF said, ‘Yeah, we’ll archive it. We’ll grab it, process it, and keep everything. That changes the science you can do.”
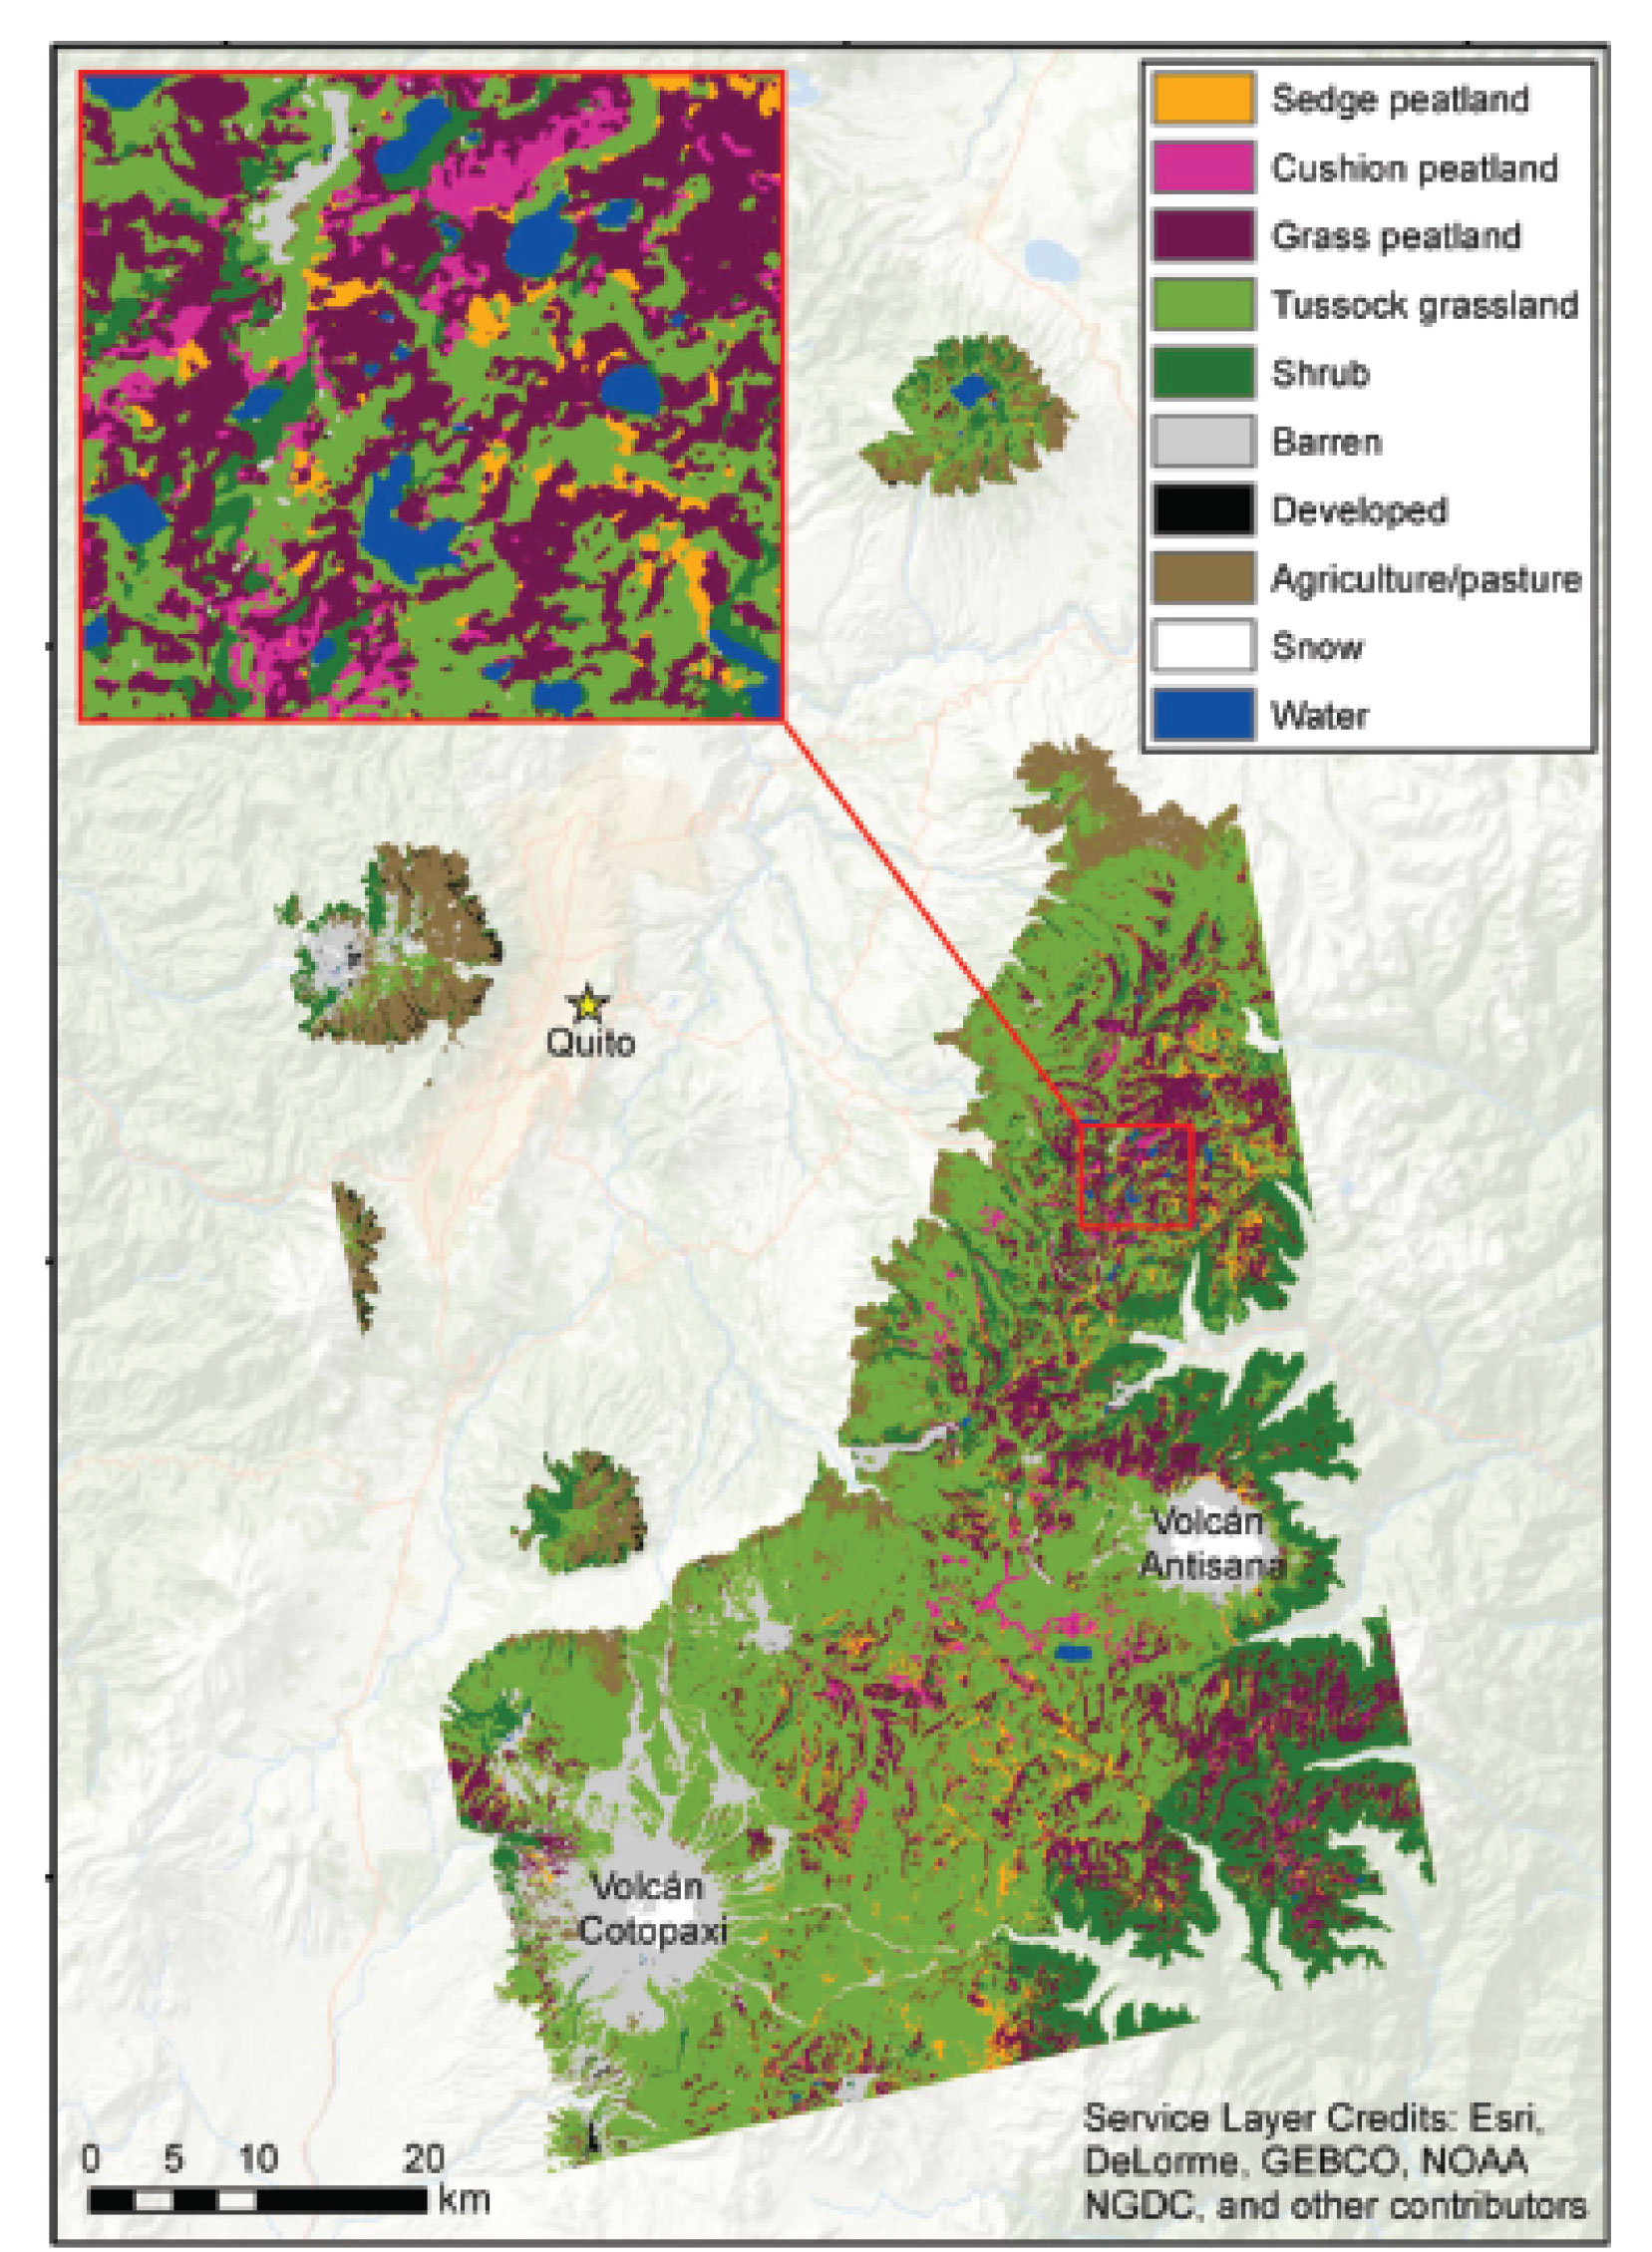
I began as a junior research scientist using ERS-1 remote-sensing satellite data processed by ASF. They were the receiving station at that time. I was one of the people that came on at the beginning and then continued to use data from them. And I started to do a lot of boreal and wetland research. In the beginning, we were seeing what we could see with a C-band satellite. We were able to easily detect burn areas in Alaska. In the springtime, when they were wet, they showed up really bright.
We use radar for detecting vernal pools, which are pools under forest canopy that are only there from maybe March (in the temperate zone) to maybe mid-June or early July, and then they disappear. They’re fishless and an important habitat for amphibians. We’ve had projects where we’re mapping them, but they change in how long they are wet. Sometimes it’s cut short, and then the species there are at risk.
Arizona Department of Water Resources (DWR)
“We’re seeing more and more problems with excessive groundwater pumping, more and more farms double, triple cropping. Groundwater levels are declining, and we’re seeing subsidence rates in one area of half a foot and more each year. There’s a good chance we’ll see subsidence in excess of 20 feet in that area in the not-so-distant future.”
My background is in hydrology, and it’ll be almost 25 years since I’ve been working for DWR on subsidence, where the ground sinks because we’ve over-pumped the aquifer. This has been a problem in south central and southern Arizona for going on 70 years now. We started monitoring it in the late 90s, using traditional surveying methods, setting up known benchmarks, and revisiting those to look at elevation changes.
In 2001, we were contacted by a researcher at the University of Texas at the Center for Space Research, and Arizona is a great place to do InSAR (Interferometric Synthetic Aperture Radar) because it has a very dry climate. When the researcher showed us the technology, we were sold on it. We were able to get centimeter and sub-centimeter deformation data over a large area, 100 by 100 kilometers. We applied for a NASA grant in 2002 and were awarded a three-year NASA grant to develop our own in-house InSAR program. ASF was our source for RADARSAT-1 SAR data, and back then, they’d send us CDs and DVDs. Now of course, we do it through a web interface and download in real time.