







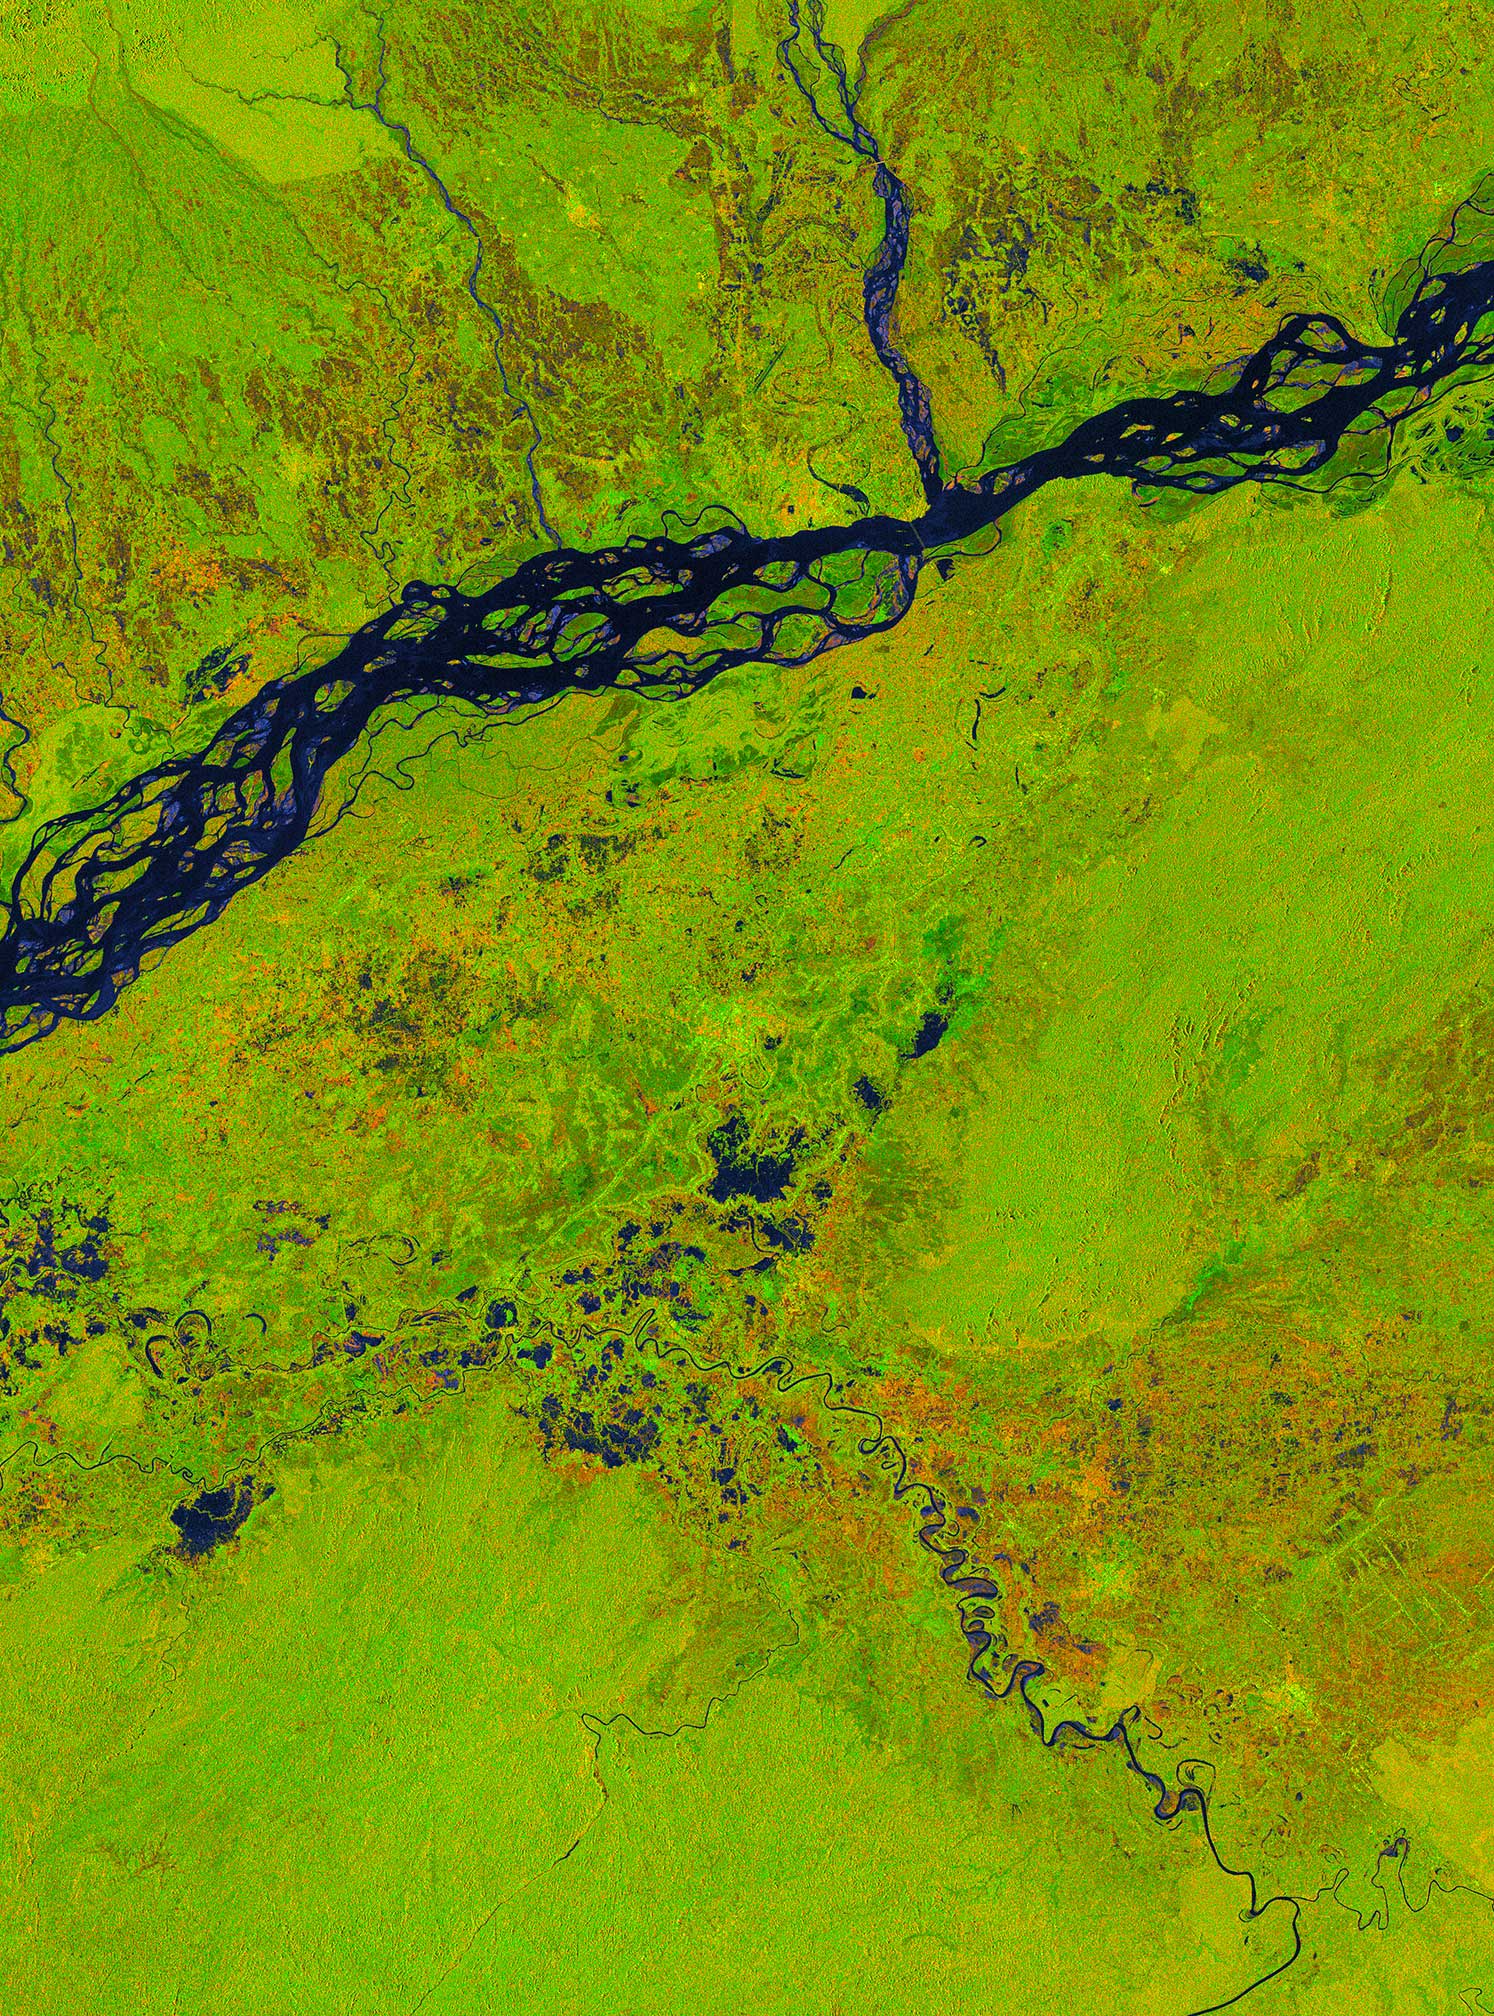
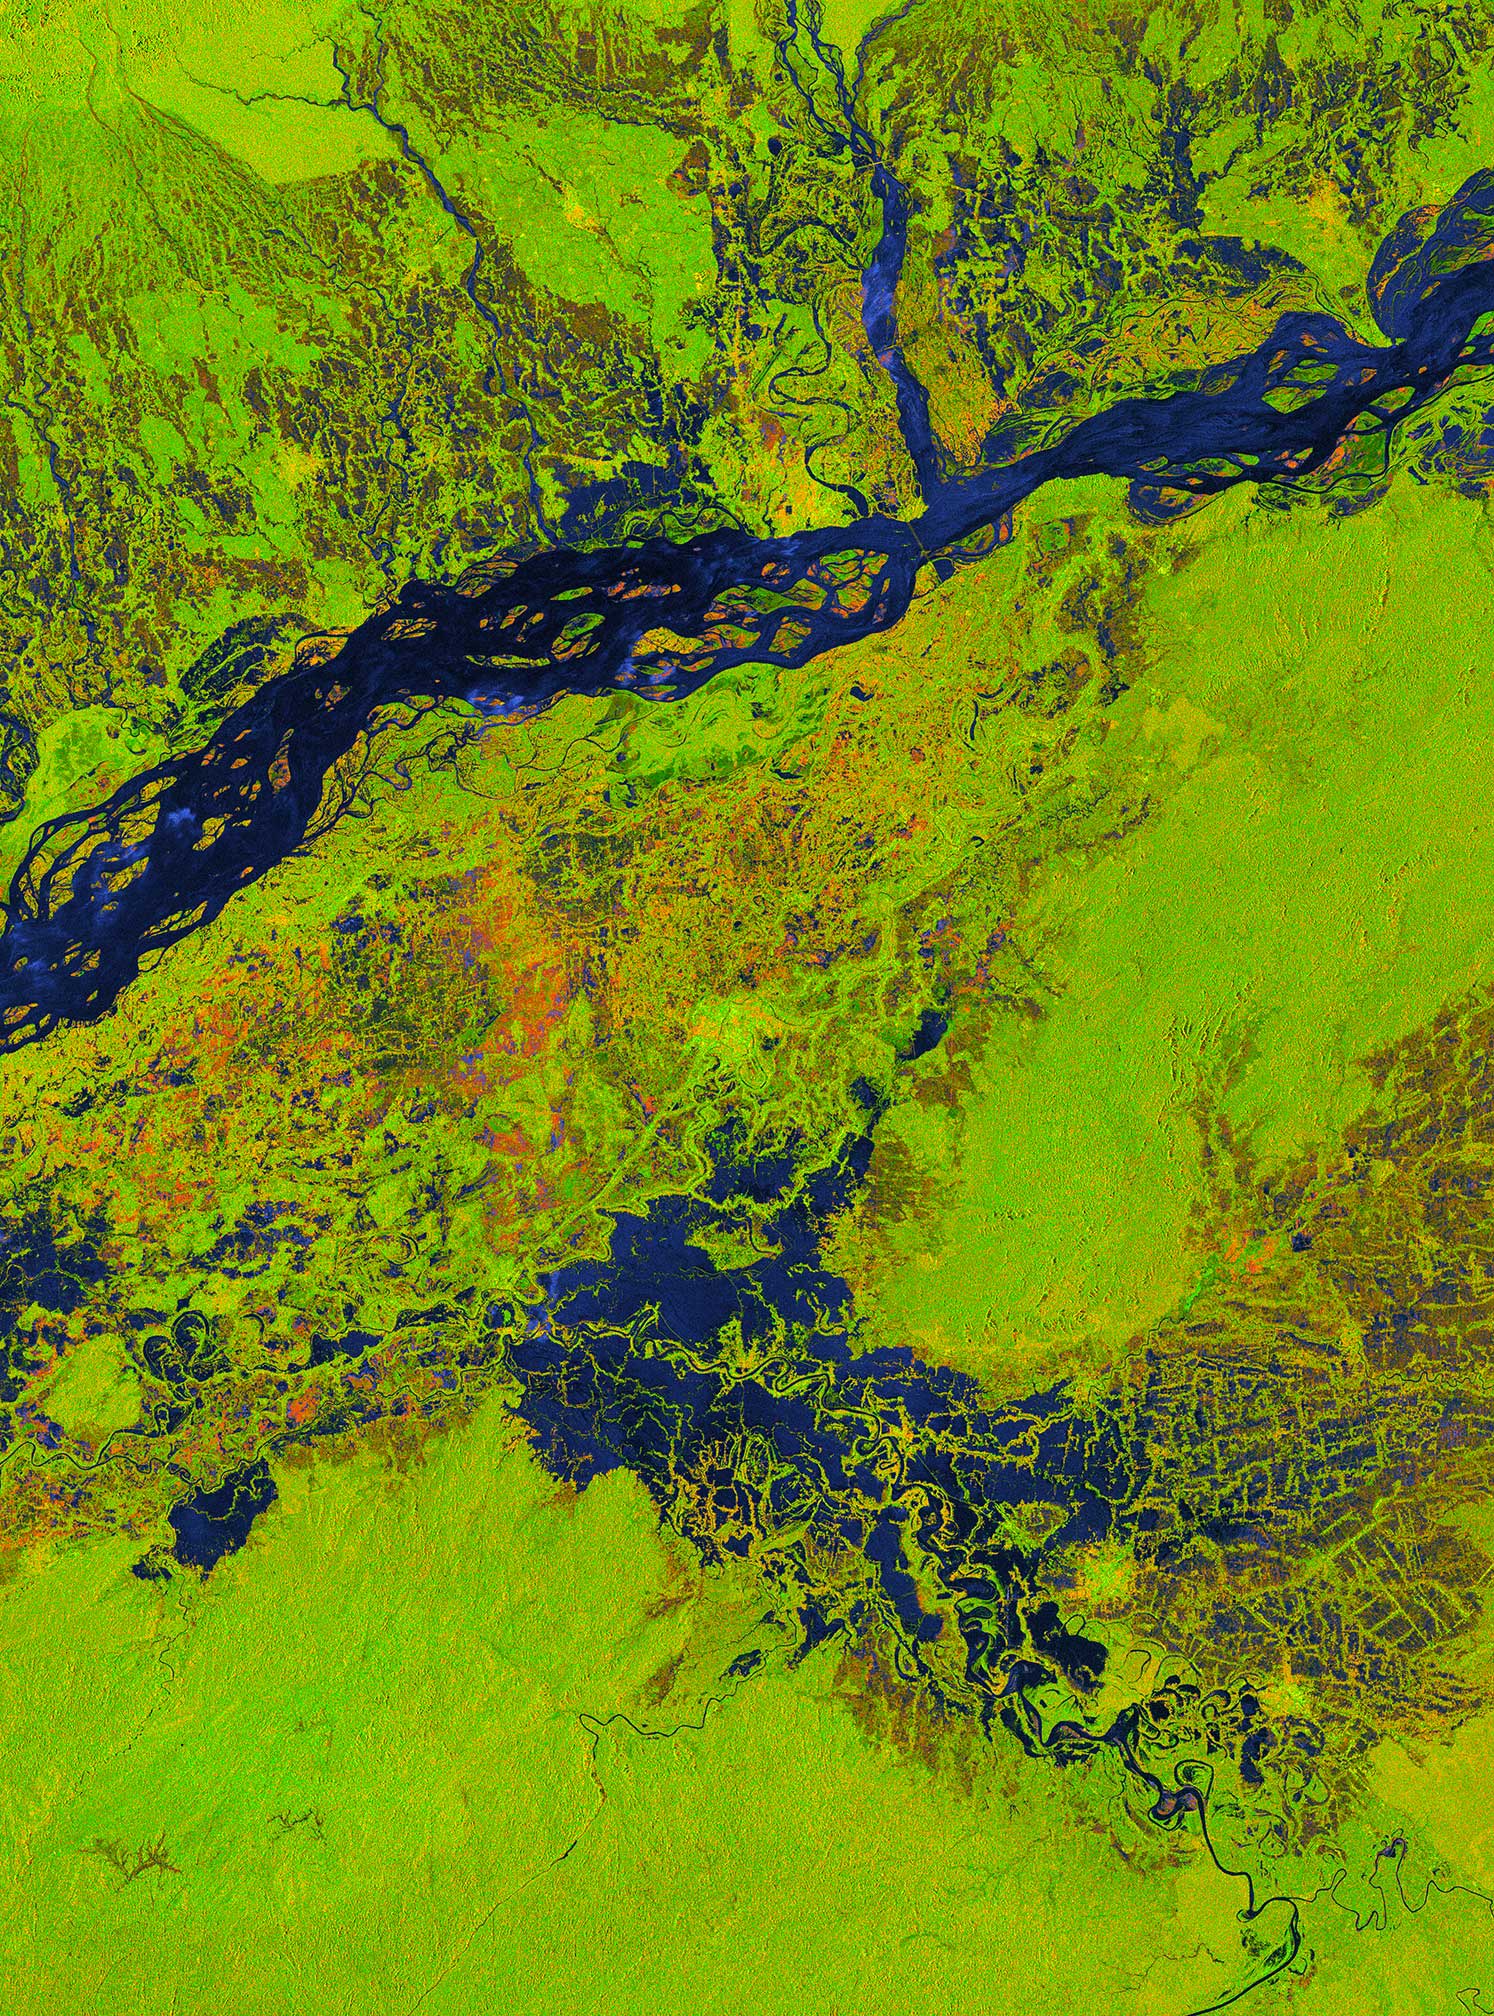
SAR images taken before, during, and after flood events enable scientists to accurately map inundated regions and assess flooding extents.
Disaster Monitoring
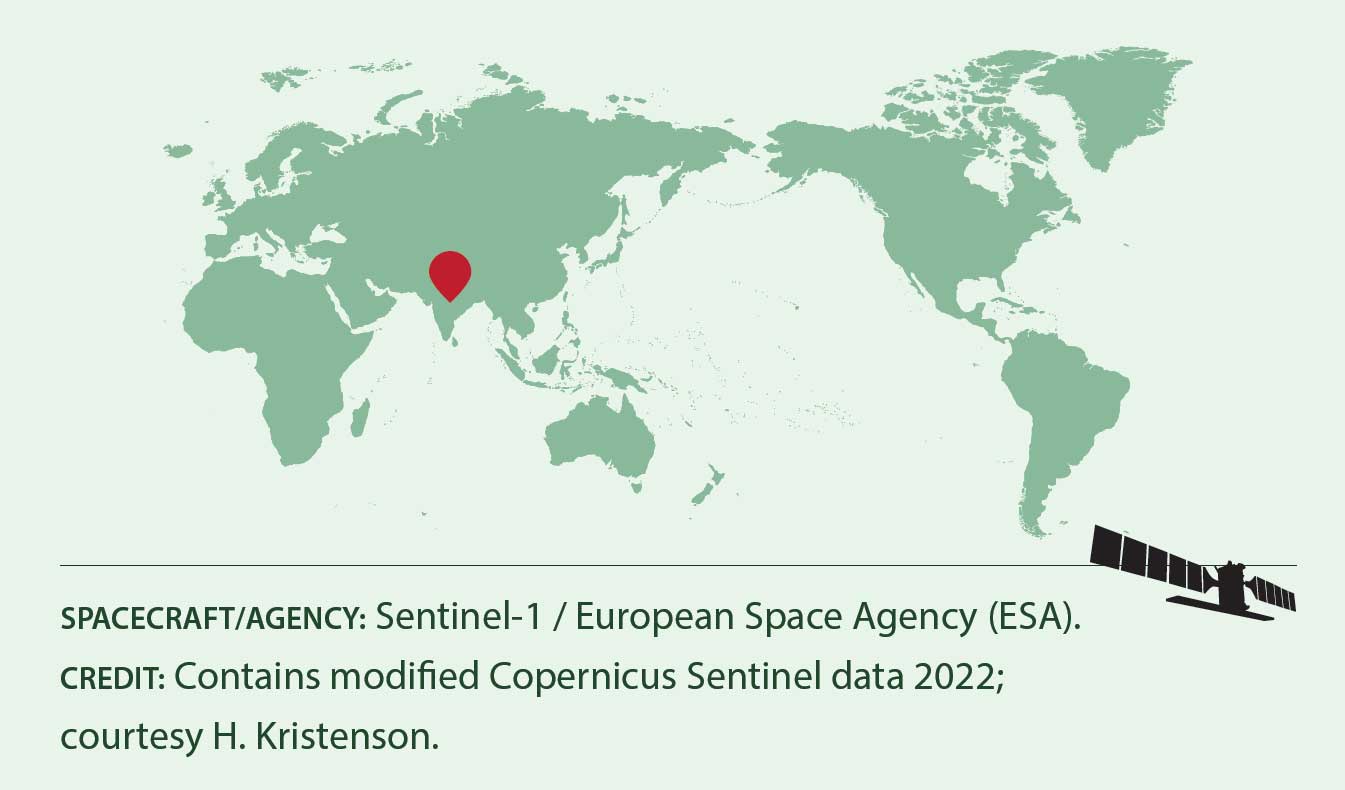
Location: India and Bangladesh
Date(s): 2022
Spacecraft/Agency: Sentinel-1 / European Space Agency (ESA).
Credit: Contains modified Copernicus Sentinel data 2022; courtesy H. Kristenson.
The Brahmaputra River flows through the northern Himalayas into Assam and Bangladesh, where it merges with the Ganges River and empties into the Bay of Bengal. The river is prone to catastrophic flooding in the spring as it carries runoff from snowmelt in the Himalayas. HydroSAR is a joint UAF/NASA/JPL service that uses Sentinel-1 SAR data to monitor surface water extents and depth. Flood monitoring along the Brahmaputra is one example of how HydroSAR is used to assist in disaster monitoring and risk mitigation.
Record Rains
Location: Mississippi River, north of St. Louis
Date(s): Summer 2019
Spacecraft/Agency: Sentinel-1 / European Space Agency (ESA).
Credit: Contains modified Copernicus Sentinel data 2019.
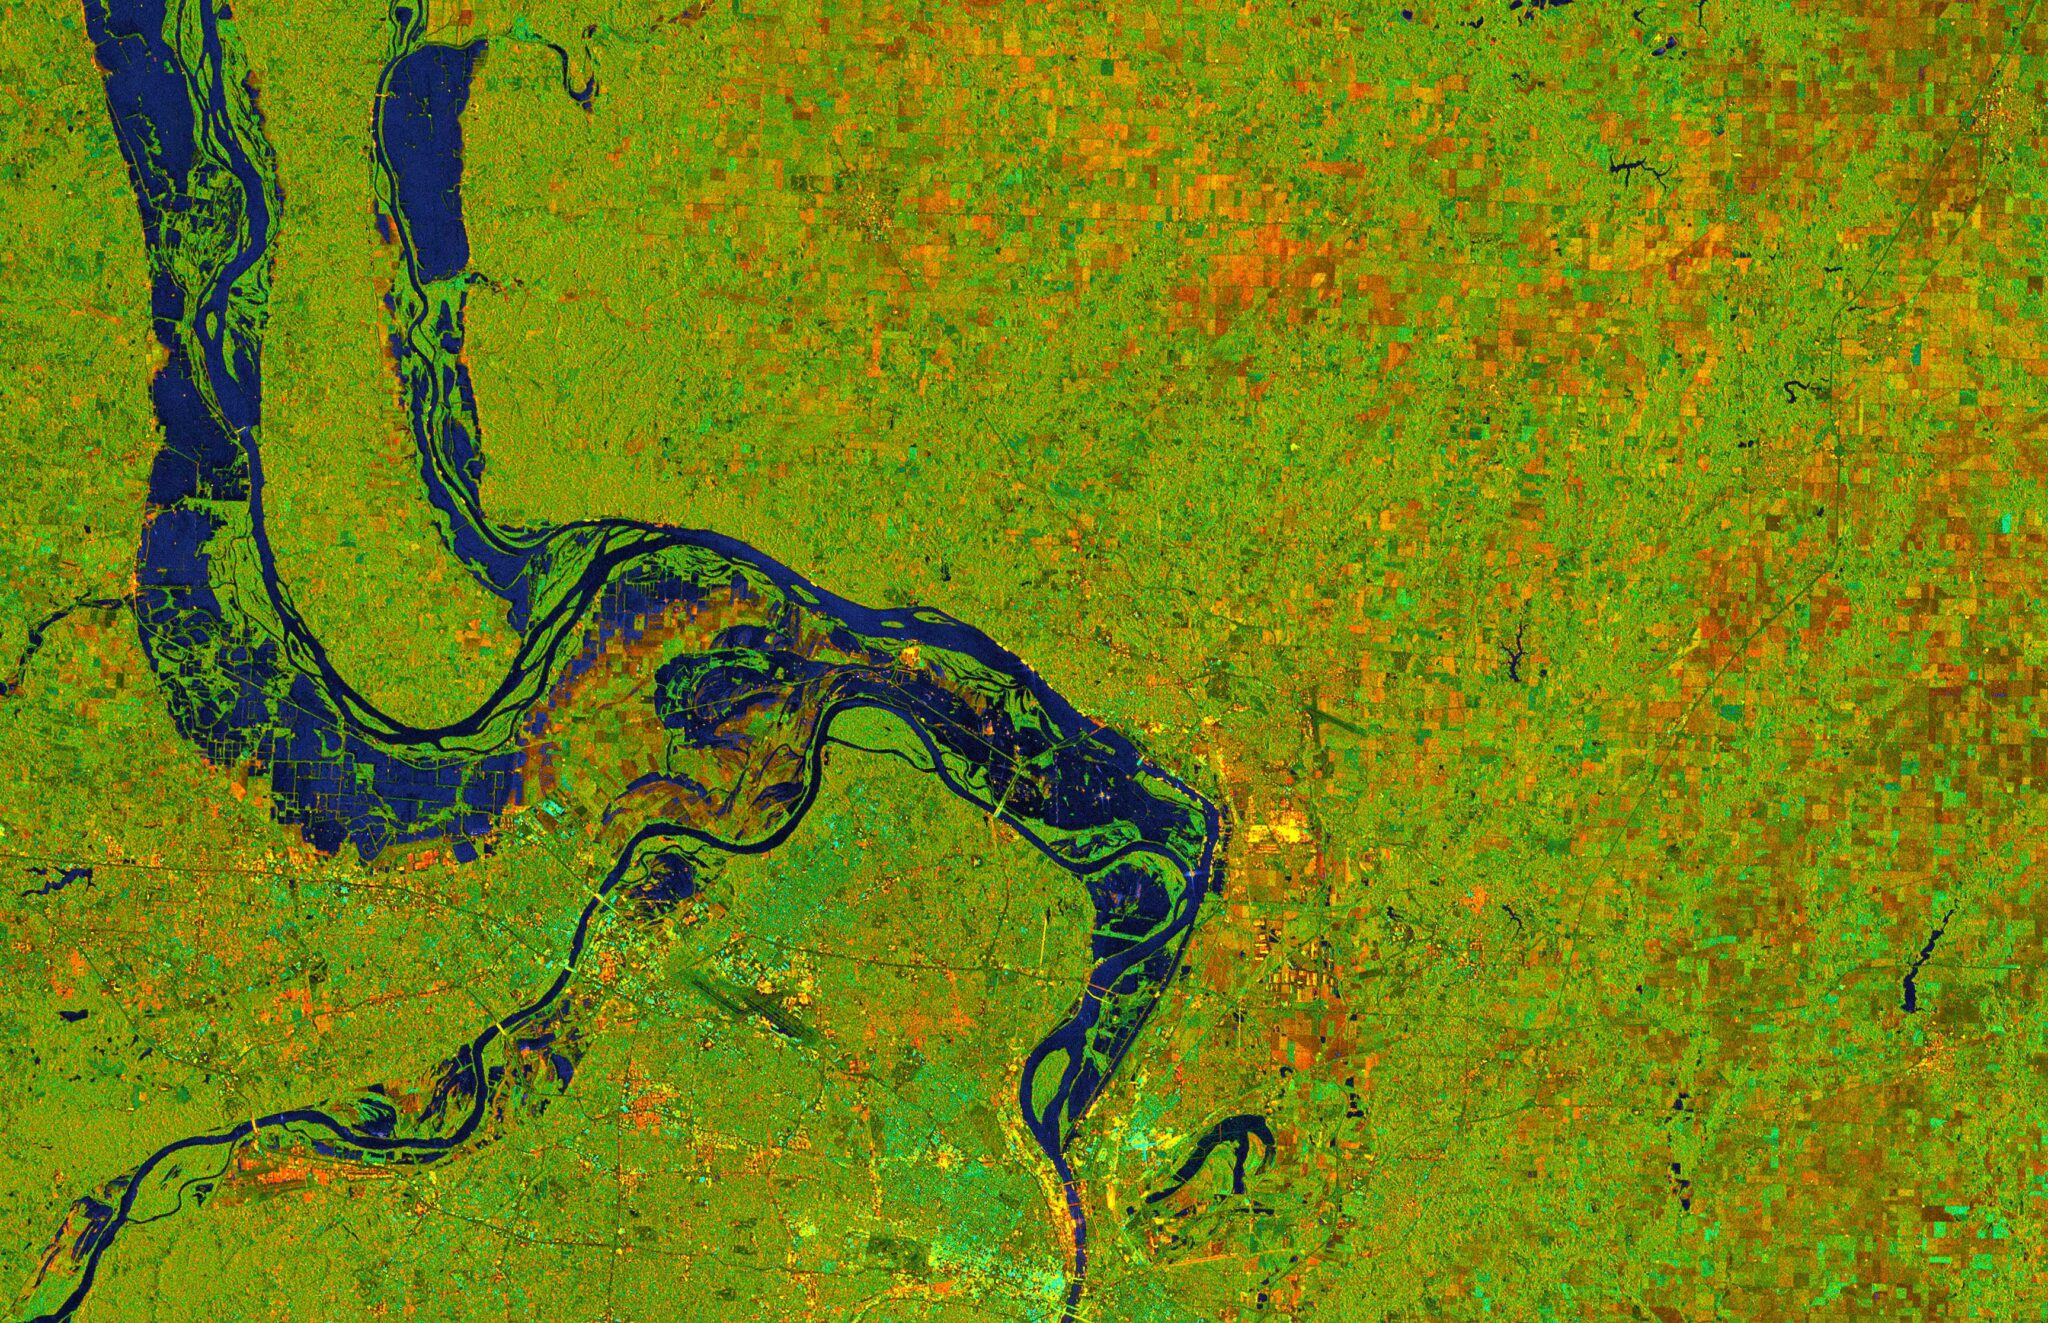
Flooding in the Mississippi River basin was unprecedented in 2019, both in duration and the amount of precipitation received. The flooding accounted for more than $20 billion in damages. By mid-June the river had crested at 14 meters (46 ft) in St. Louis, the second highest level ever recorded. These Sentinel-1 images show the Mississippi just north of St. Louis before and after record rains and snowmelt occurred in the Midwest in April and May.


Cyclone Landfall
Location: Mozambique
Date(s): 2019
Spacecraft/Agency: Sentinel-1 / European Space Agency (ESA).
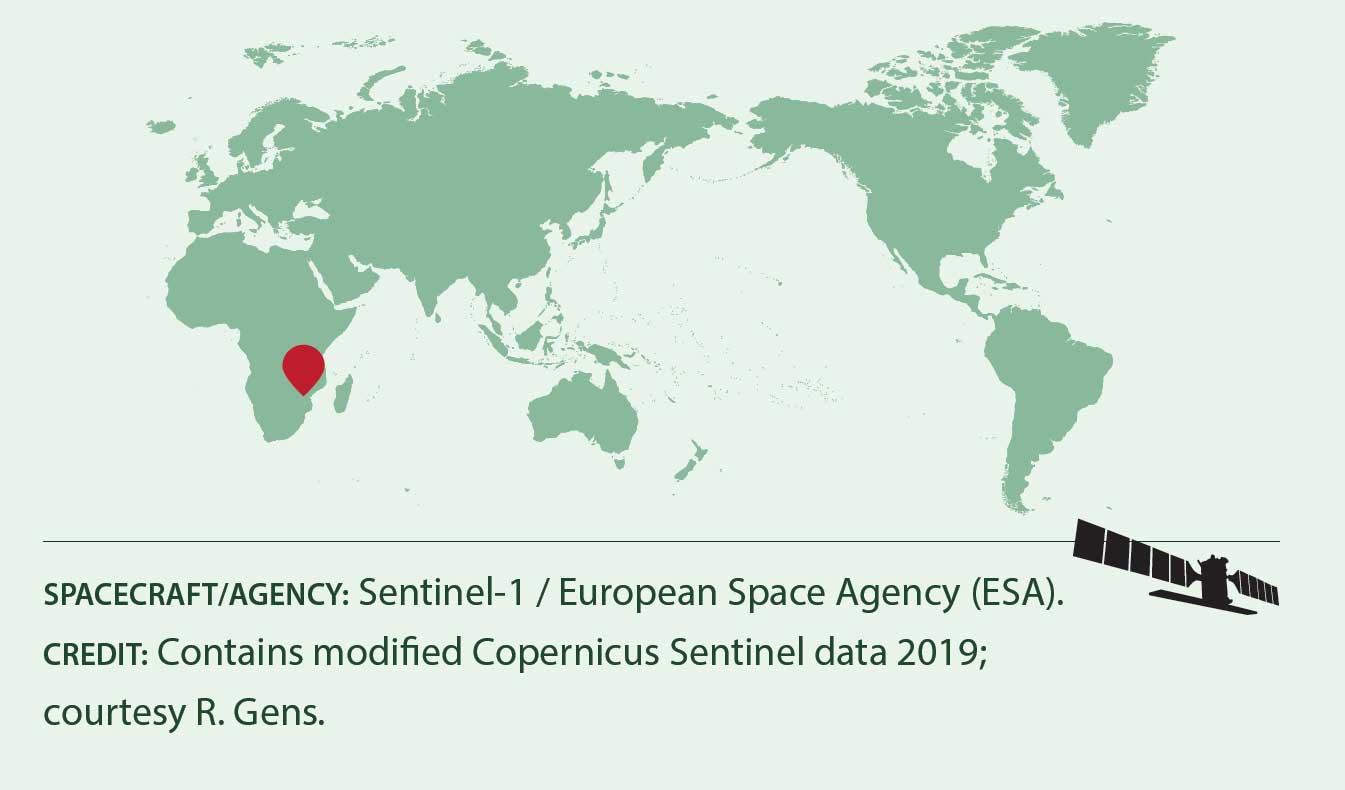
Credit: Contains modified Copernicus Sentinel data 2019; courtesy R. Gens.
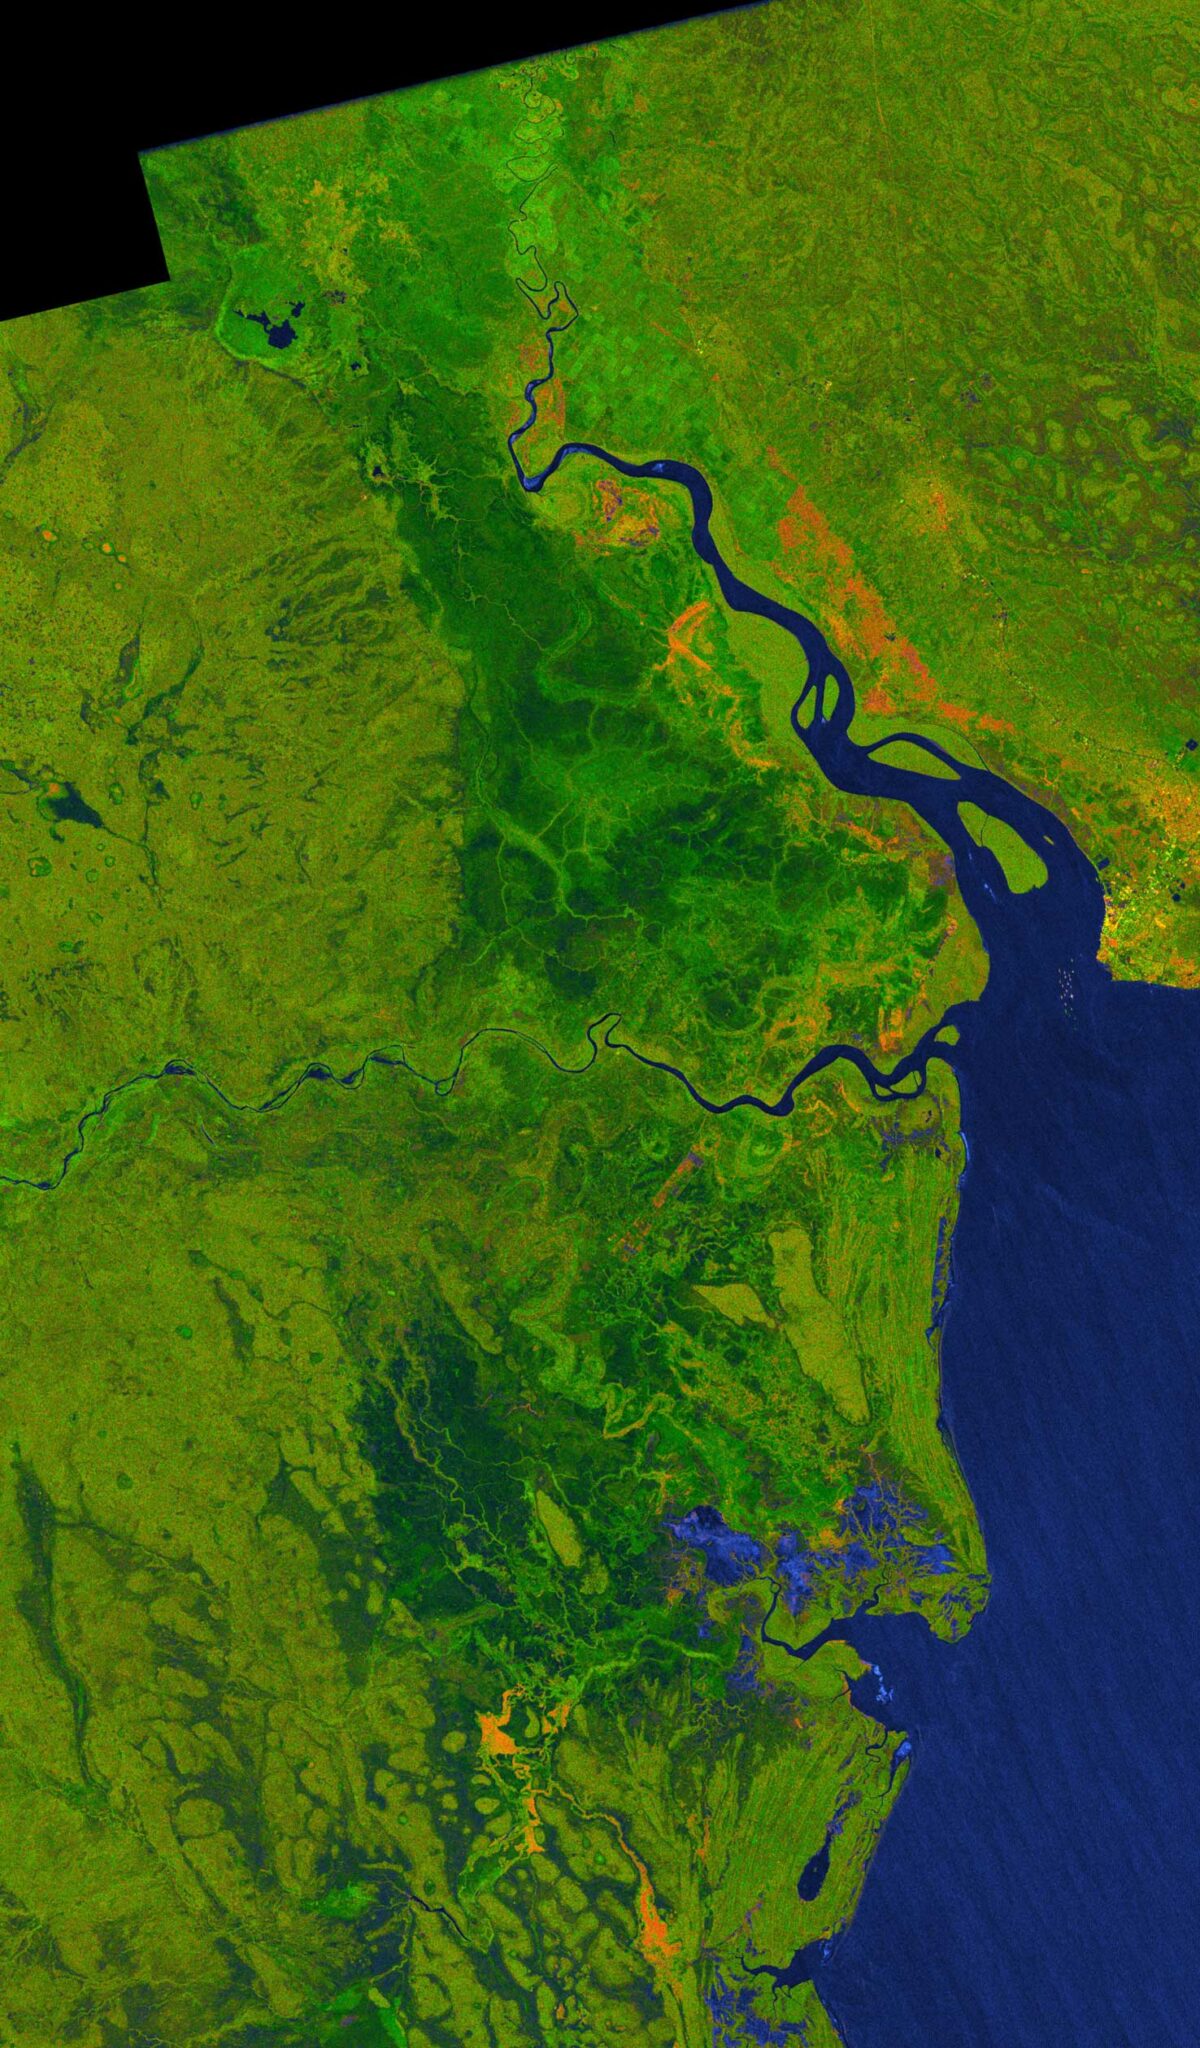
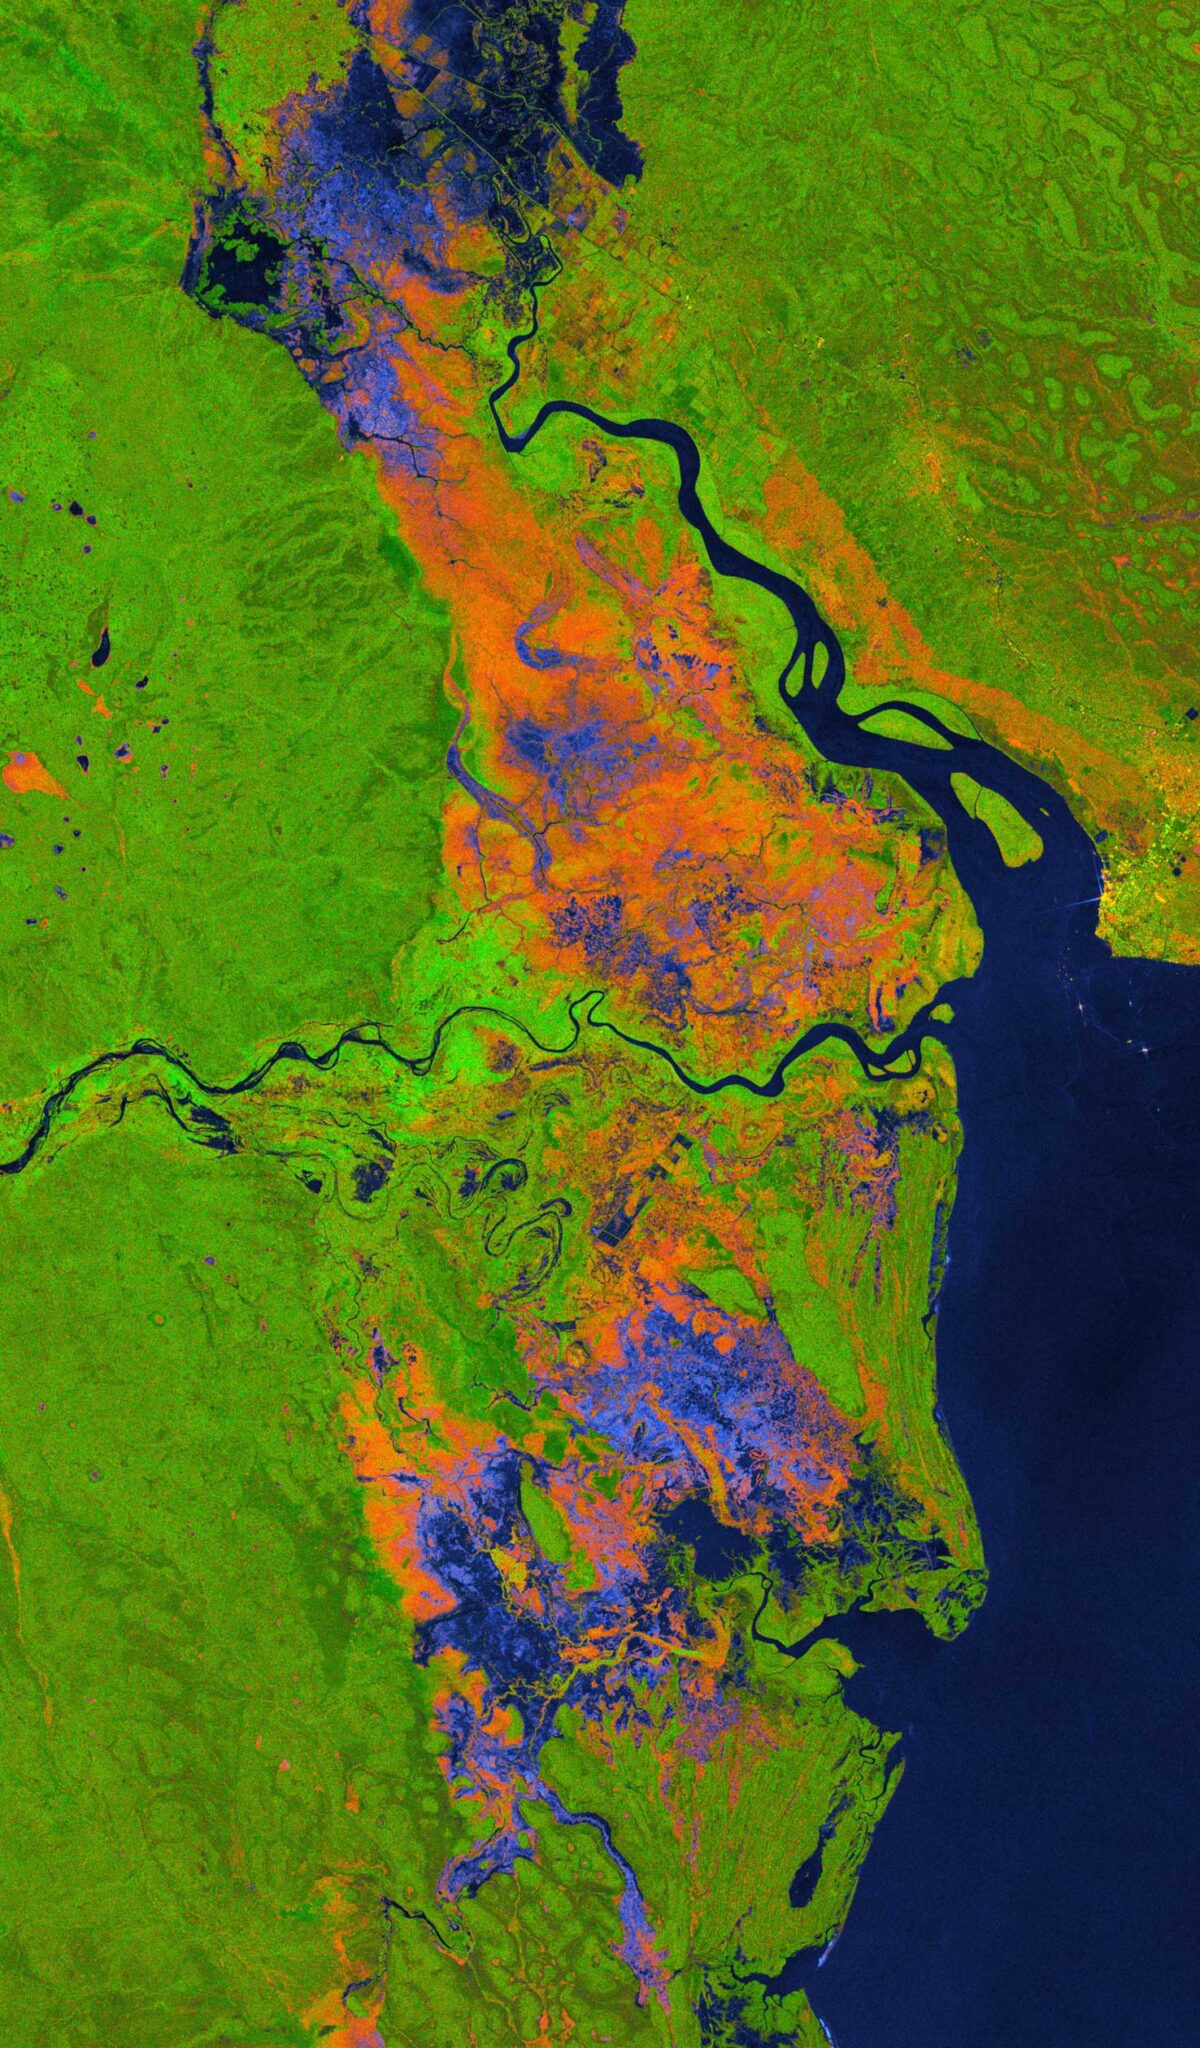
This sequence of Sentinel-1 RGB decompositions shows the impact of Cyclone Idai on the coastal areas of Mozambique in 2019. The first image shows the area just before the cyclone’s landfall on March 14. The next image (March 19) clearly displays a large flooded area in dark blue. The third image (March 25) shows the area after the cyclone dissipated. The food water evaporated or drained away, leaving behind residual ponds and saturated soils.