




Video examples of SAR used in earth observation science
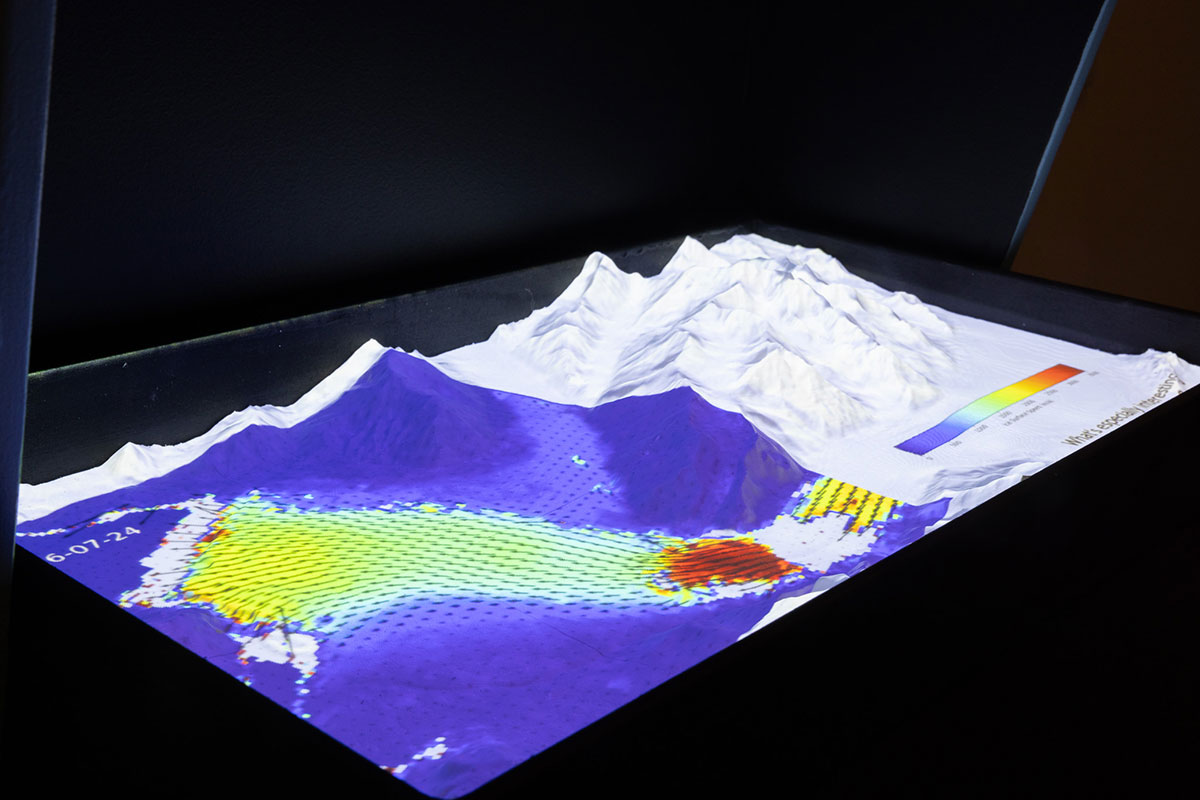
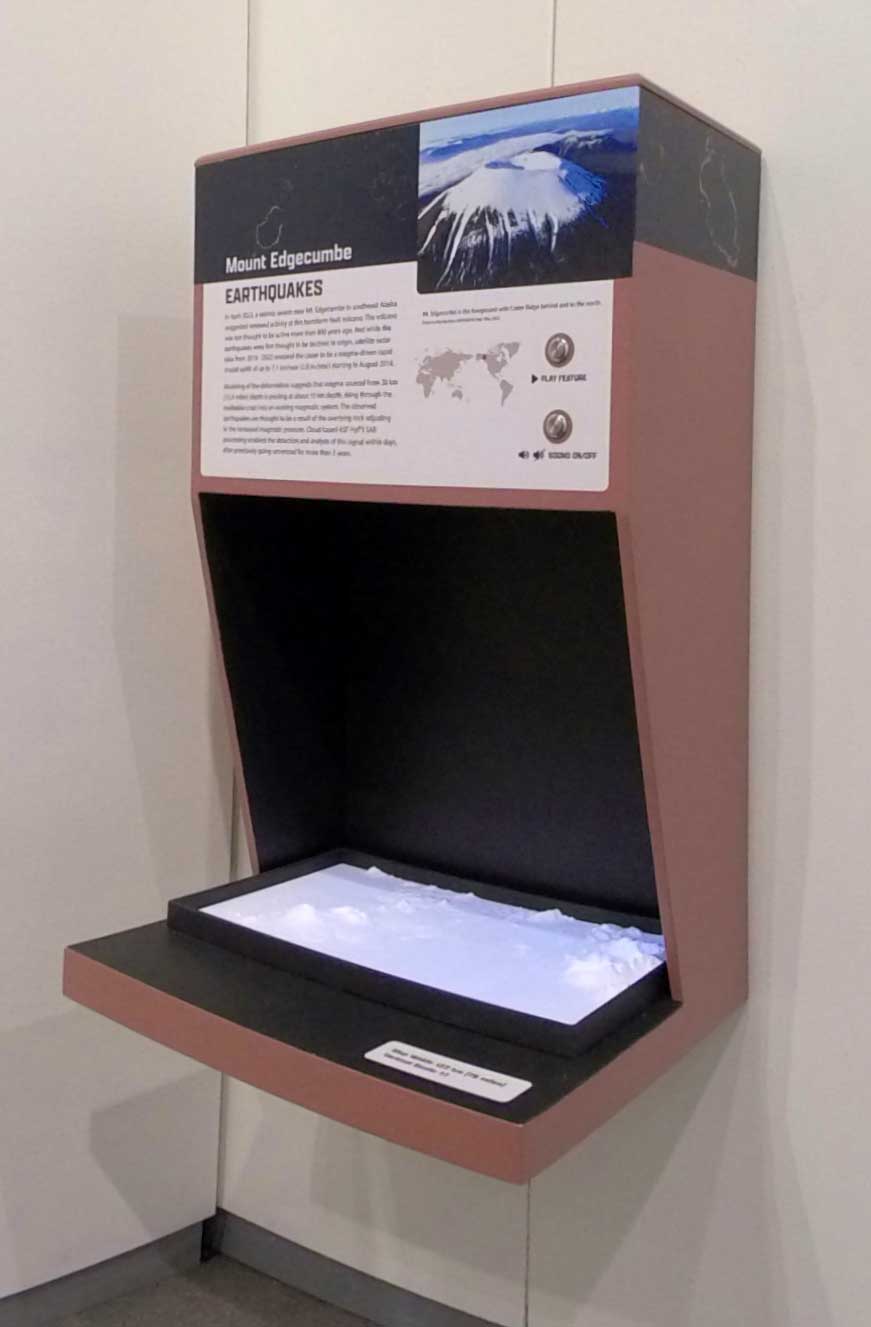
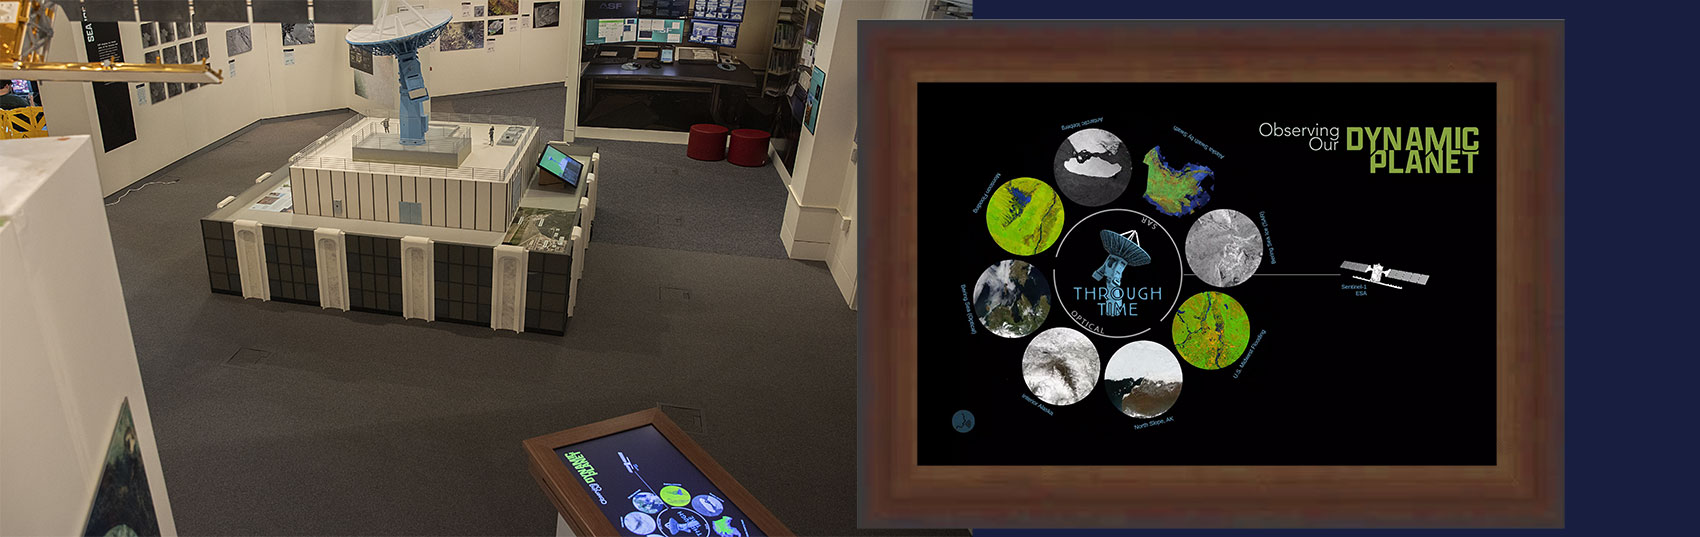
In the museum exhibit three videos were housed in a custom case which projected colored elevation maps from above onto a 3D printed terrain elevation map to show how each process progressed over time and how it impacted the areas where they occurred.
The three videos below follow the development and processes of different natural events caused by volcanic activity, seasonal flooding, and glacier flow. Listen or read along to learn how these processes are visualized and studied with the help of SAR data.
Mt Edgecumbe
Earthquakes
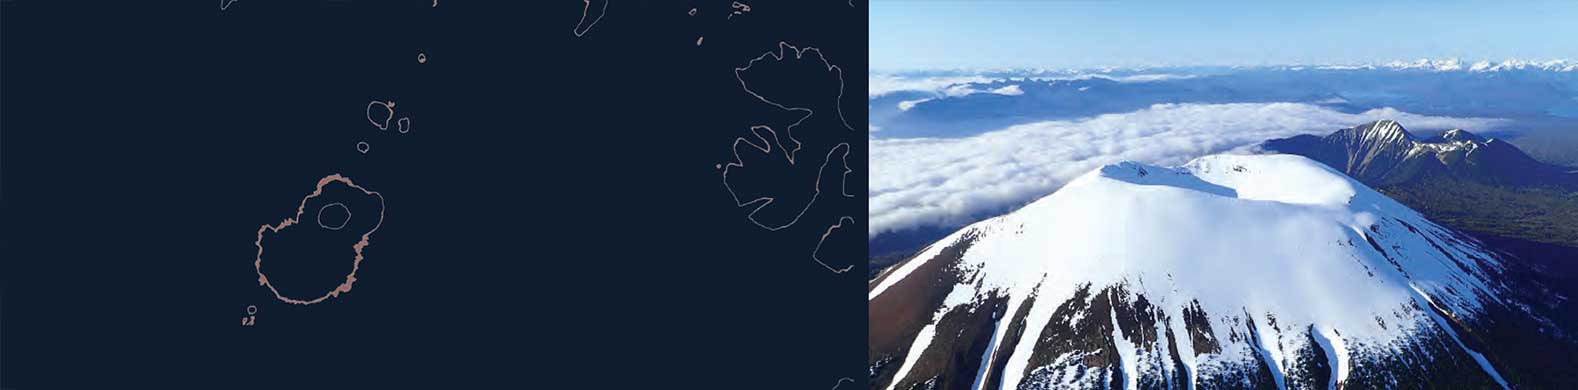
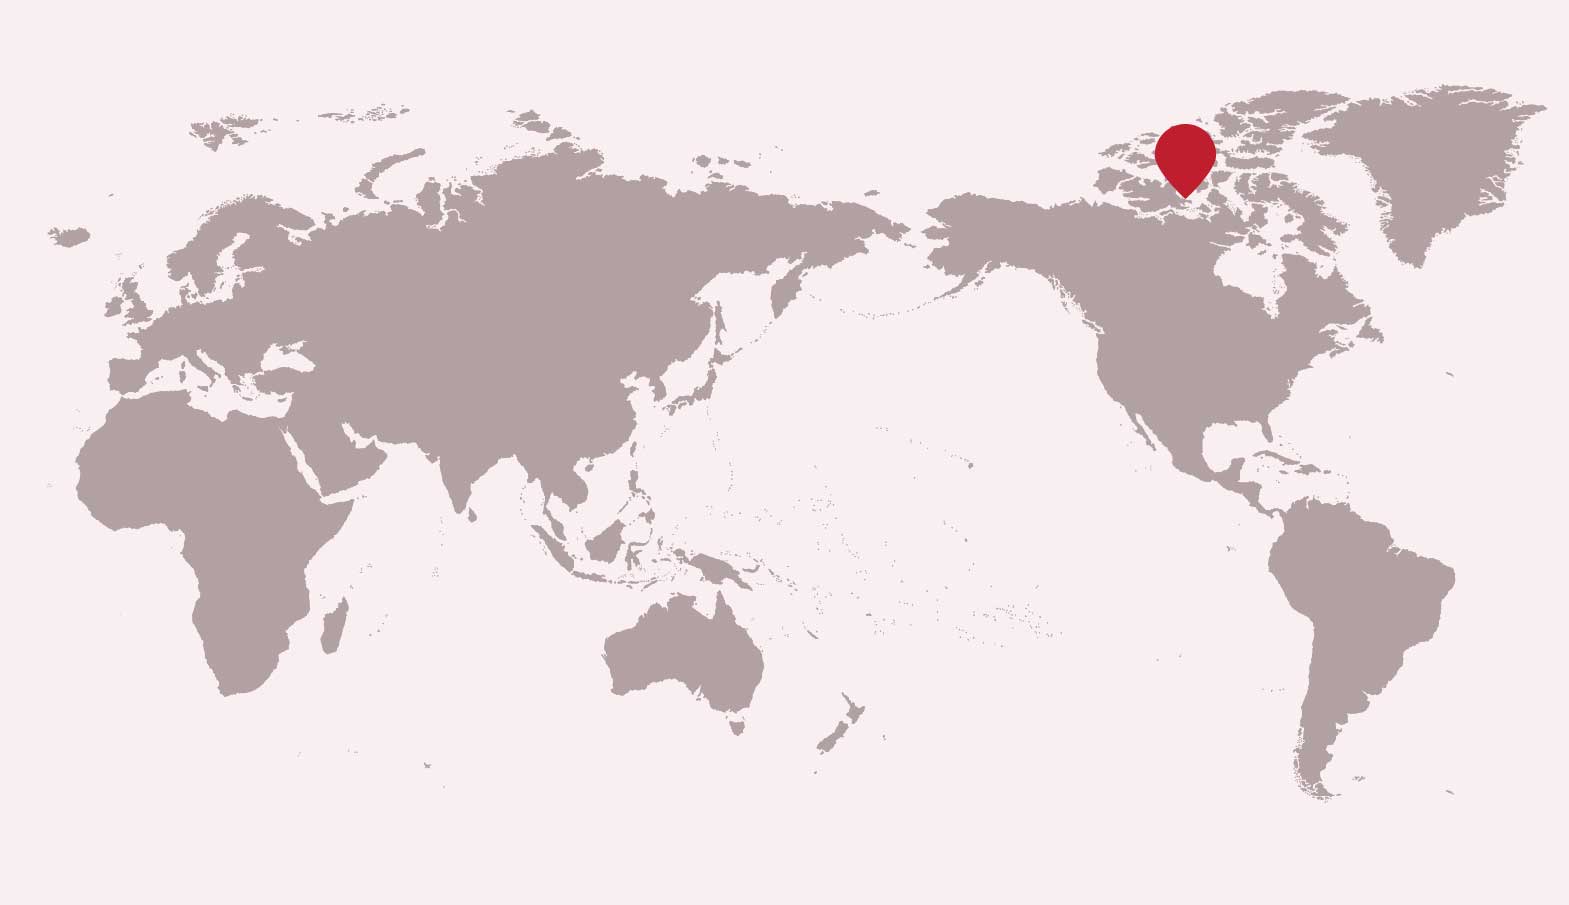
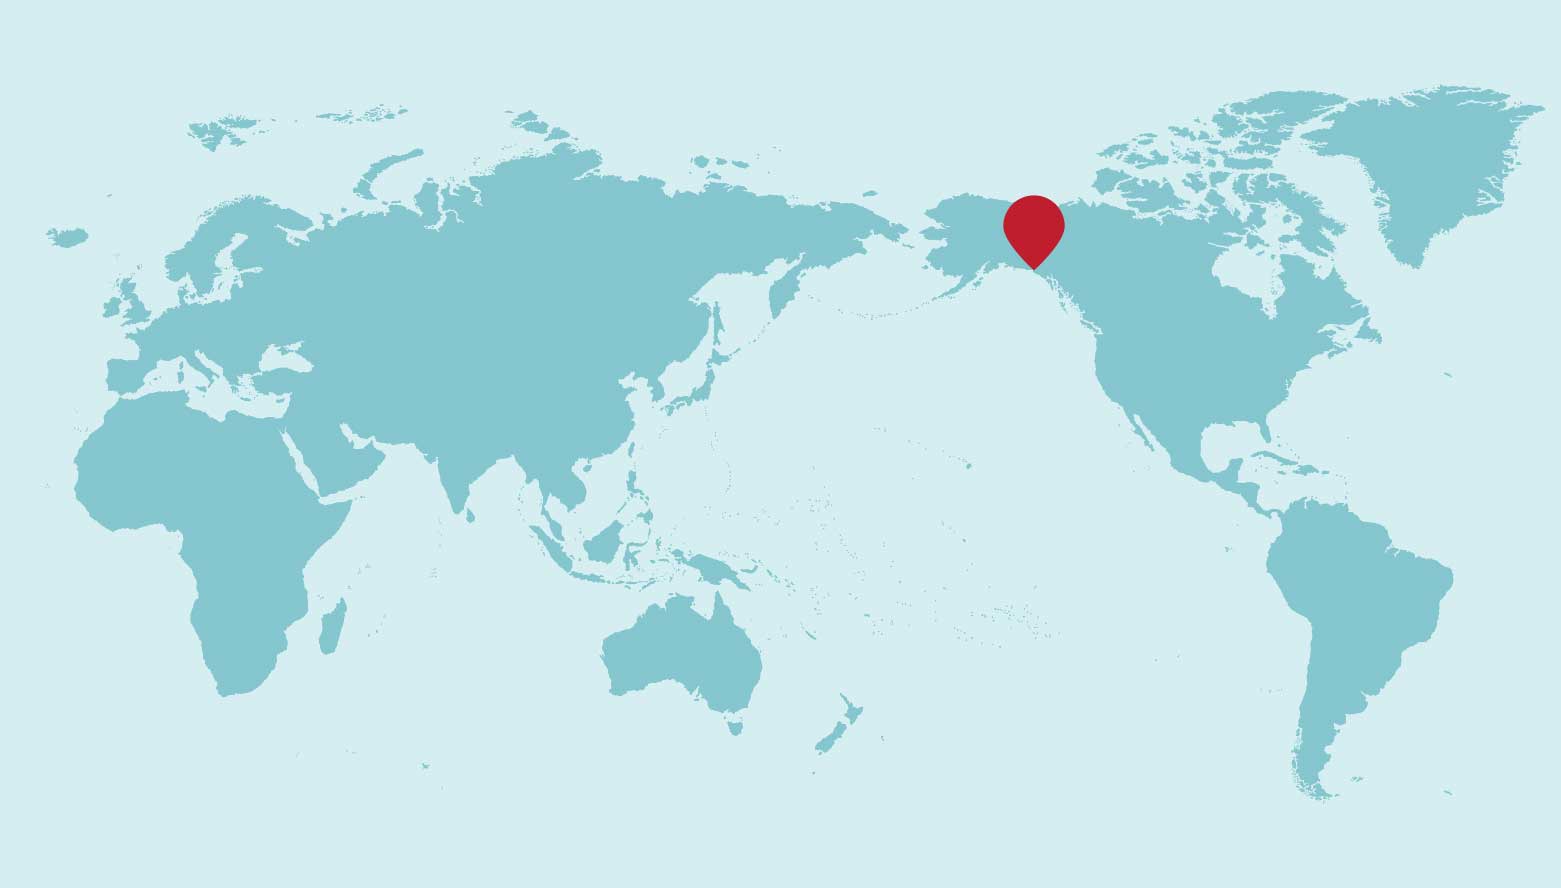
In April 2022, a seismic swarm near Mt. Edgecumbe in southeast Alaska suggested renewed activity at this transform fault volcano. This volcano was last thought active more than 800 years ago. While the earthquakes were first thought to be tectonic, Satellite radar data from 2014 to 2022 revealed the cause to be a magma-driven rapid upward crustal motion of up to 7.1cm/year starting in August 2018.
Modeling of the deformation suggests that magma sourced from 20 km depth is pooling at about 10 km depth, rising through the malleable crust into an existing magmatic system. The observed earthquakes are thought to be created as the overlying rock adjusts to the increased magmatic pressure. Cloud-native open data and workflows enabled the discovery and analysis of this signal within days after previously going unnoticed for more than 3 years.
Hindu-Kush-Himalaya (HKH)
Flood Extent
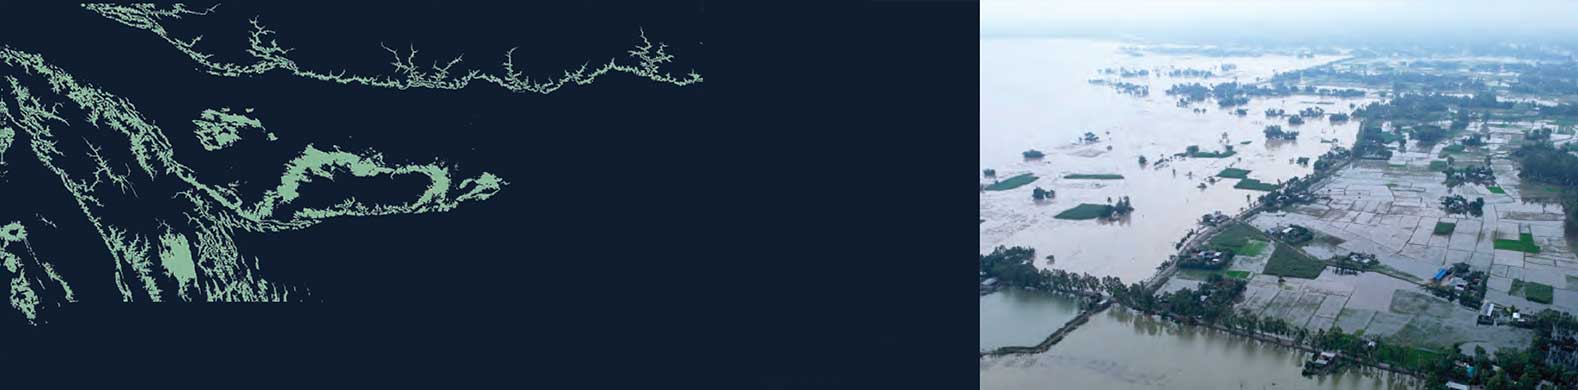
Waters from the Hindu-Kush-Himalaya (HKH) mountain region feed the rivers that supply fresh water to South and Southeast Asia. The lowlands south of the mountains often flood during the monsoon season, and it can be difficult to use optical imagery to observe these events due to extensive cloud cover. Because SAR can penetrate through clouds, it is a valuable tool for monitoring surface water dynamics.
This time series displays images that integrate the VV and VH (combinations of vertical and horizontal) polarizations of Sentinel-1 SAR acquisitions to create RGB Decomposition mosaics for each satellite pass during the 2024 rainy season (May – September). In these images, surface water generally appears blue, dense vegetation is green, and urban areas or landscapes with sparse vegetation appear orange or yellow.
Sit 'Tlein
Flow Velocity
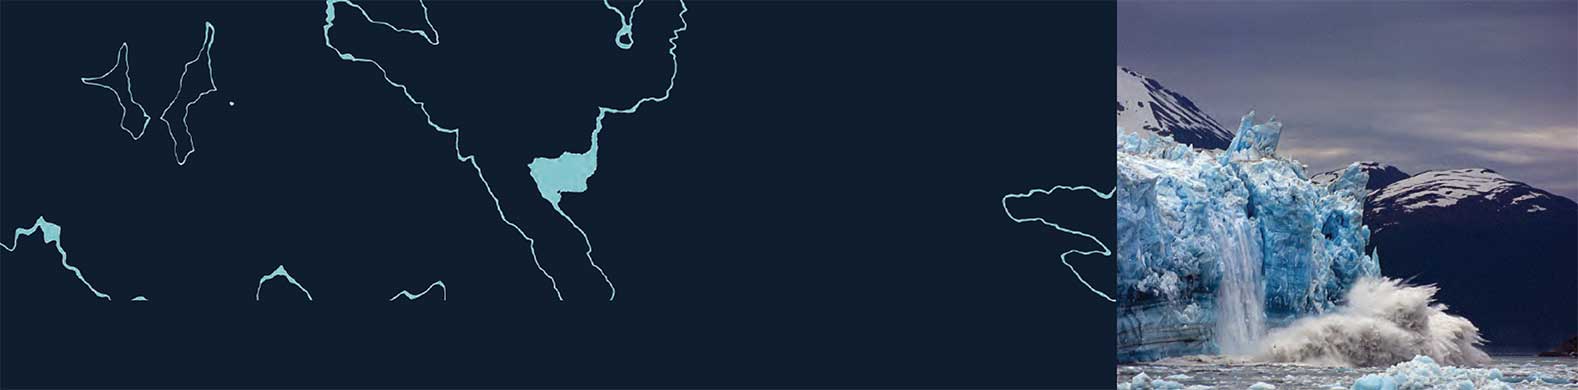
The velocities of flowing glacier ice can be calculated using pairs of images and looking for changes in the position of recognizable features over time. But while such a technique has been used for decades, in just the last few years, cloud computing and the capitalization of 40 years of publicly available SAR and optical satellite data have enabled near real-time tracking of millions of geographically paired points across every glacier in the world.
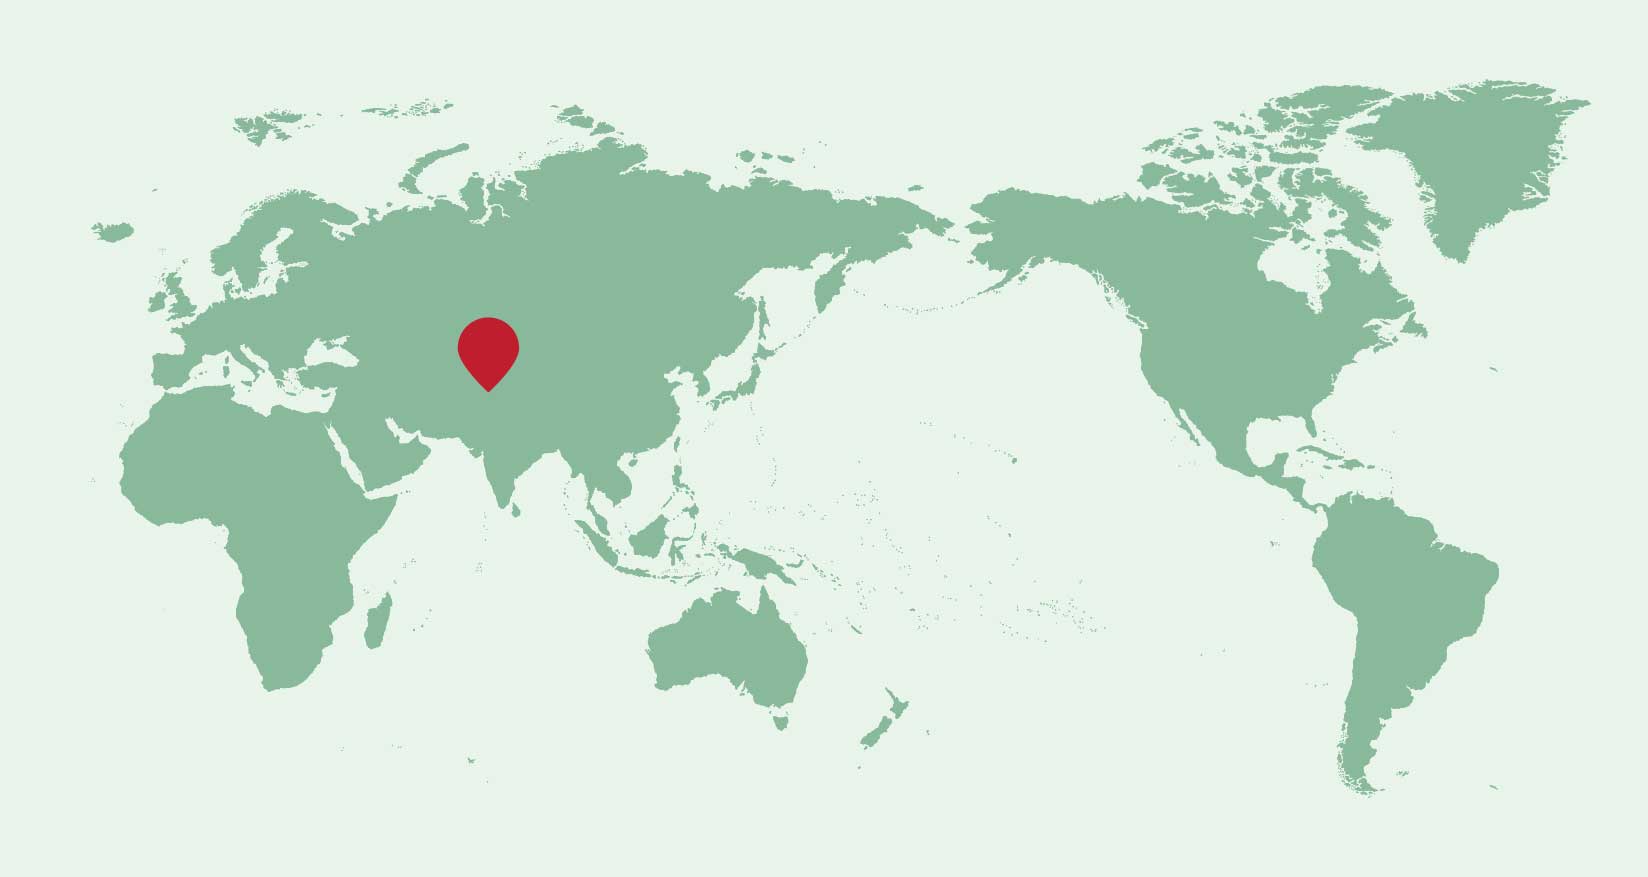
This time series shows the pulsed movements of the ice of Sít ‘Tlein (Hubbard Glacier, Alaska) from October 22, 2015 through September 3, 2016. The colors show the speed of the movement, and the arrows indicate both the magnitude and the direction of the flow. The derived velocity data was collected using IT’S_LIVE and the European Space Agency’s Sentinel-1 SAR satellites.
Through Time
A Synthetic Aperture Radar or SAR time series is an invaluable resource for a wide range of applications. By capturing repeat high-resolution images of the Earth’s surface at different points in time, SAR time series enable us to monitor and analyze dynamic processes and change – over time.
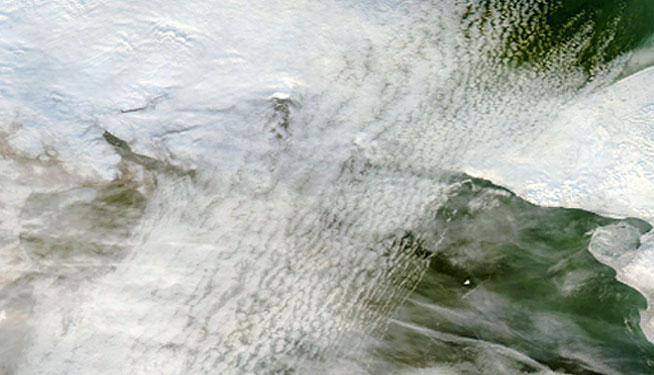
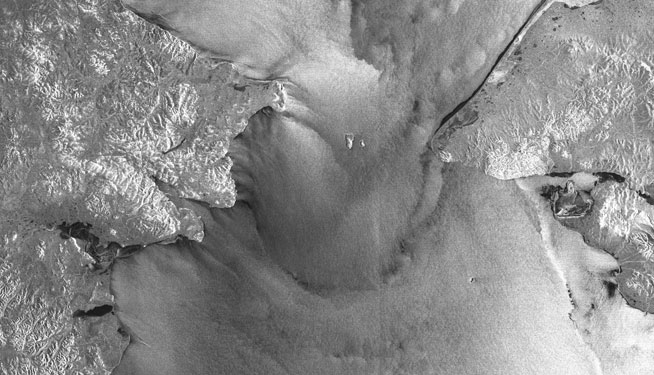
The physical museum’s interactive “touch table” display provided a selection of different Time Series with narrative explaining what is being displayed. Included here are two videos of the content grouped by sensor type, which offers a comparison between data acquired through a SAR sensor, and through an Optical sensor.