







SAR data is pivotal in earthquake monitoring due to its ability to detect ground displacement. By comparing pre- and post-earthquake SAR images, even subtle surface shifts can be identified.
InSAR techniques precisely measure these changes, creating “interferograms” that highlight deformation patterns. This data aids in mapping fault lines, identifying areas of potential seismic activity, and assessing earthquake impacts on infrastructure. SAR’s all-weather and day-night capabilities provide continuous monitoring, crucial for disaster response and mitigation efforts. In essence, SAR offers a high-resolution, timely, and comprehensive perspective on seismic events, empowering experts to make informed decisions.
Earthquake Butterfly
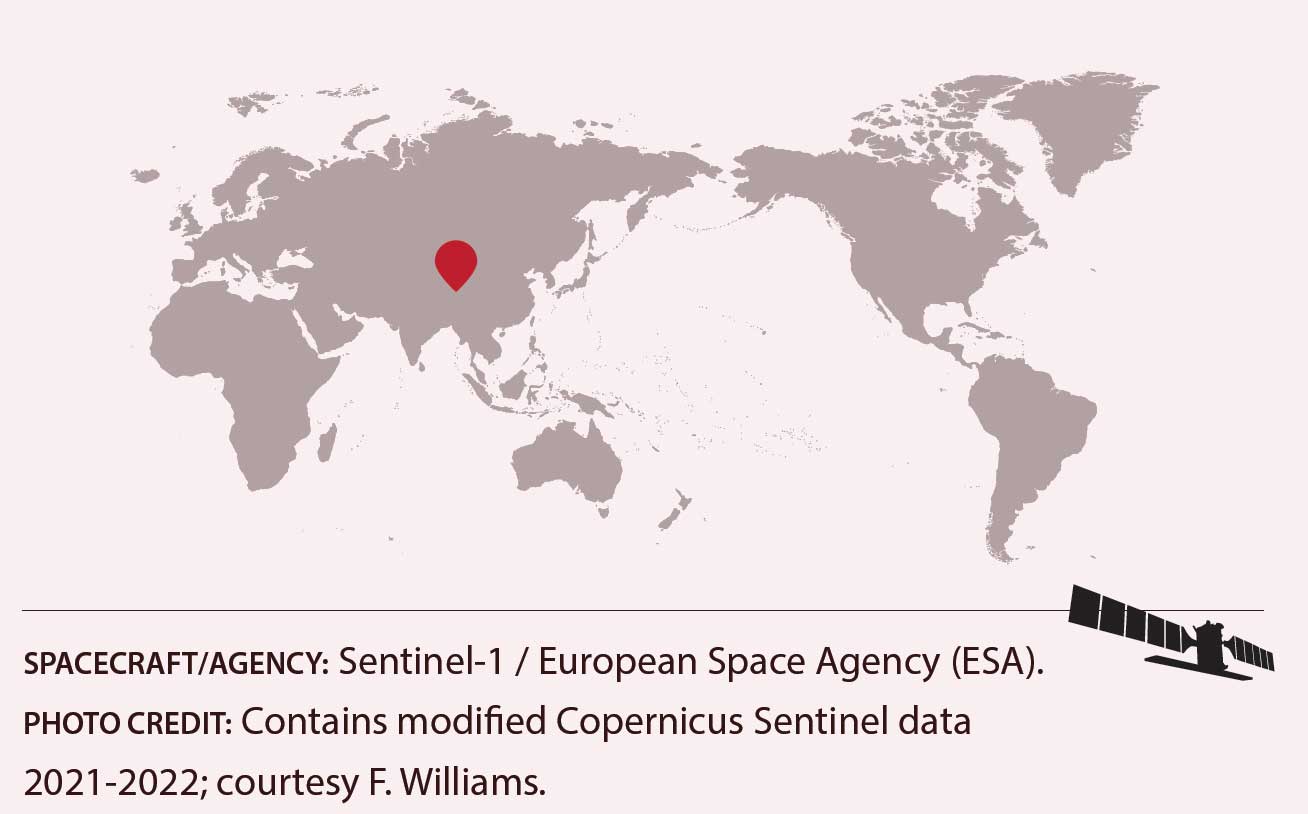
Location: Qinghai Province, China
Date(s): 2021-2022
Spacecraft/Agency: Sentinel-1 / European Space Agency (ESA).
Credit: Contains modified Copernicus Sentinel data 2021-2022; courtesy F. Williams.
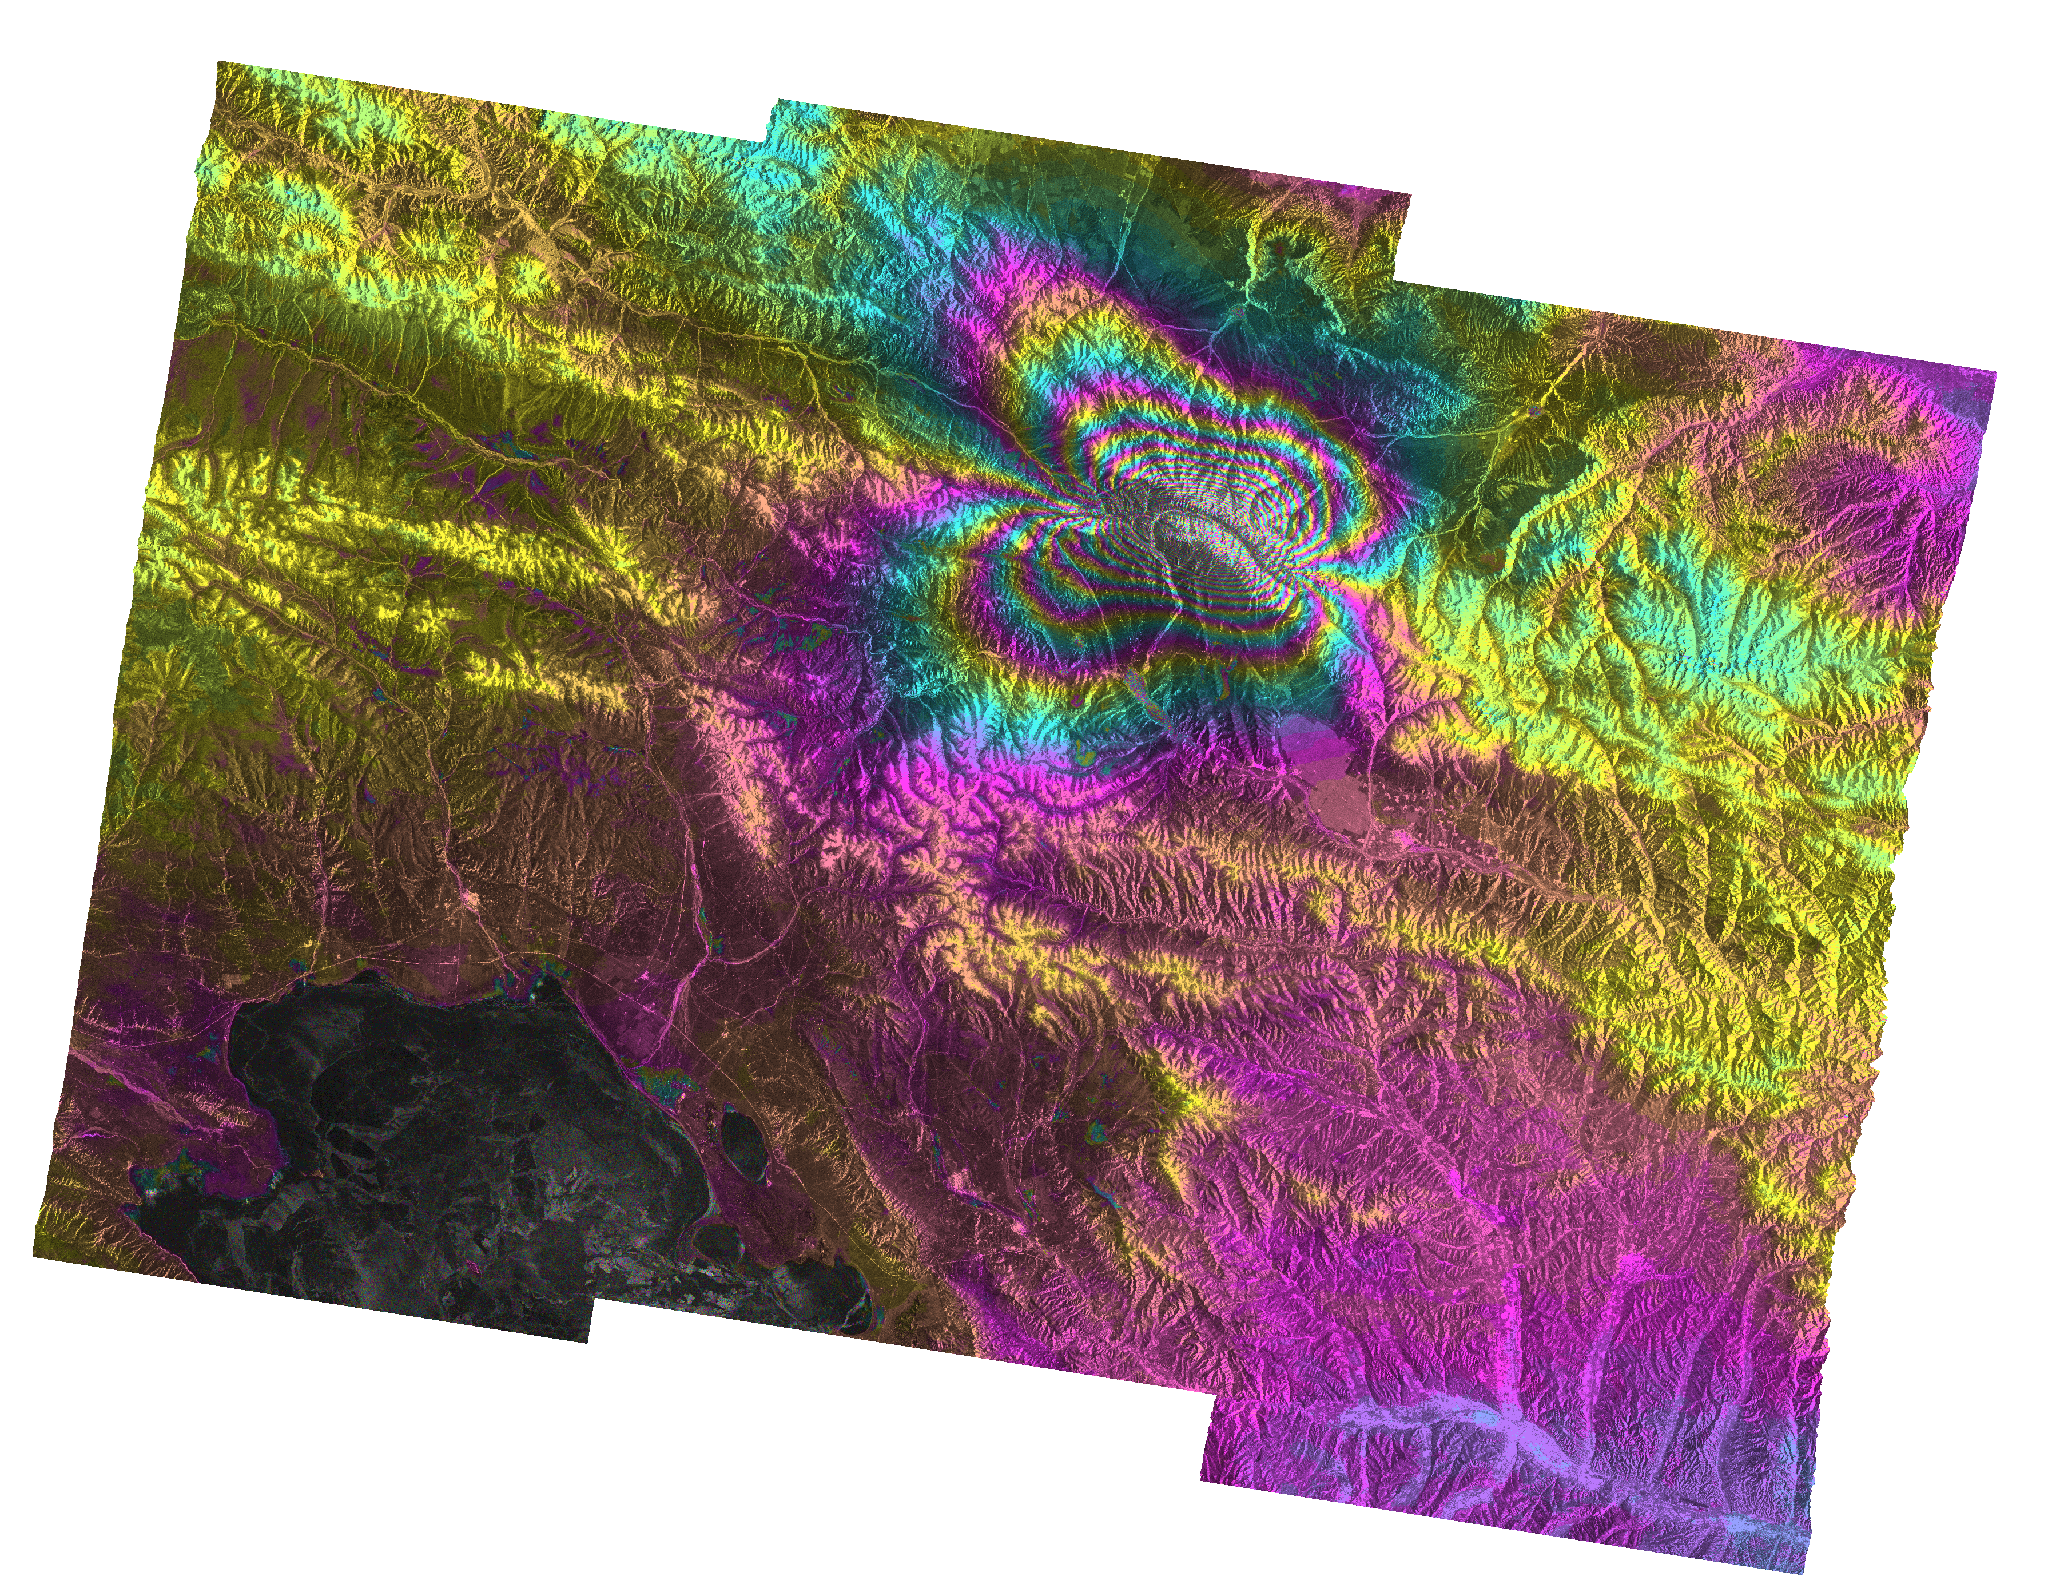
On January 6, 2022, a magnitude 6.6 earthquake occurred in northern Qinghai Province, China. The shallow quake at 10 km depth (6.2 miles) injured nine people, damaged nearly 5,000 houses, and collapsed a portion of the Great Wall of China – a section built during the Ming Dynasty. In this Sentinel-1 interferogram, each fringe (or color cycle) in the butterfly-shaped figure represents 2.8 cm (1.1 in.) of ground surface displacement.
Displacement
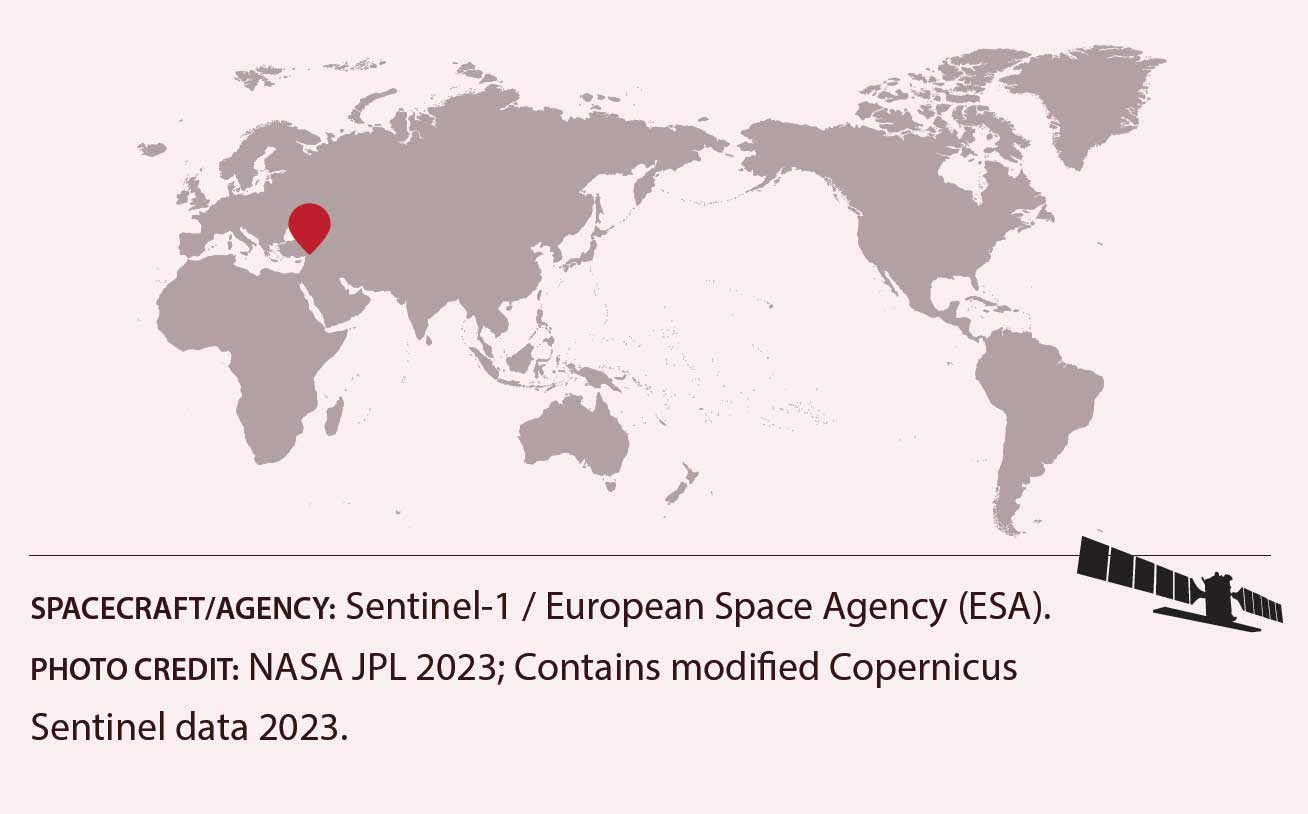
Location: Turkey and Syria
Date(s): 2023
Spacecraft/Agency: Sentinel-1 / European Space Agency (ESA).
Credit: NASA JPL 2023; Contains modified Copernicus Sentinel data 2023.
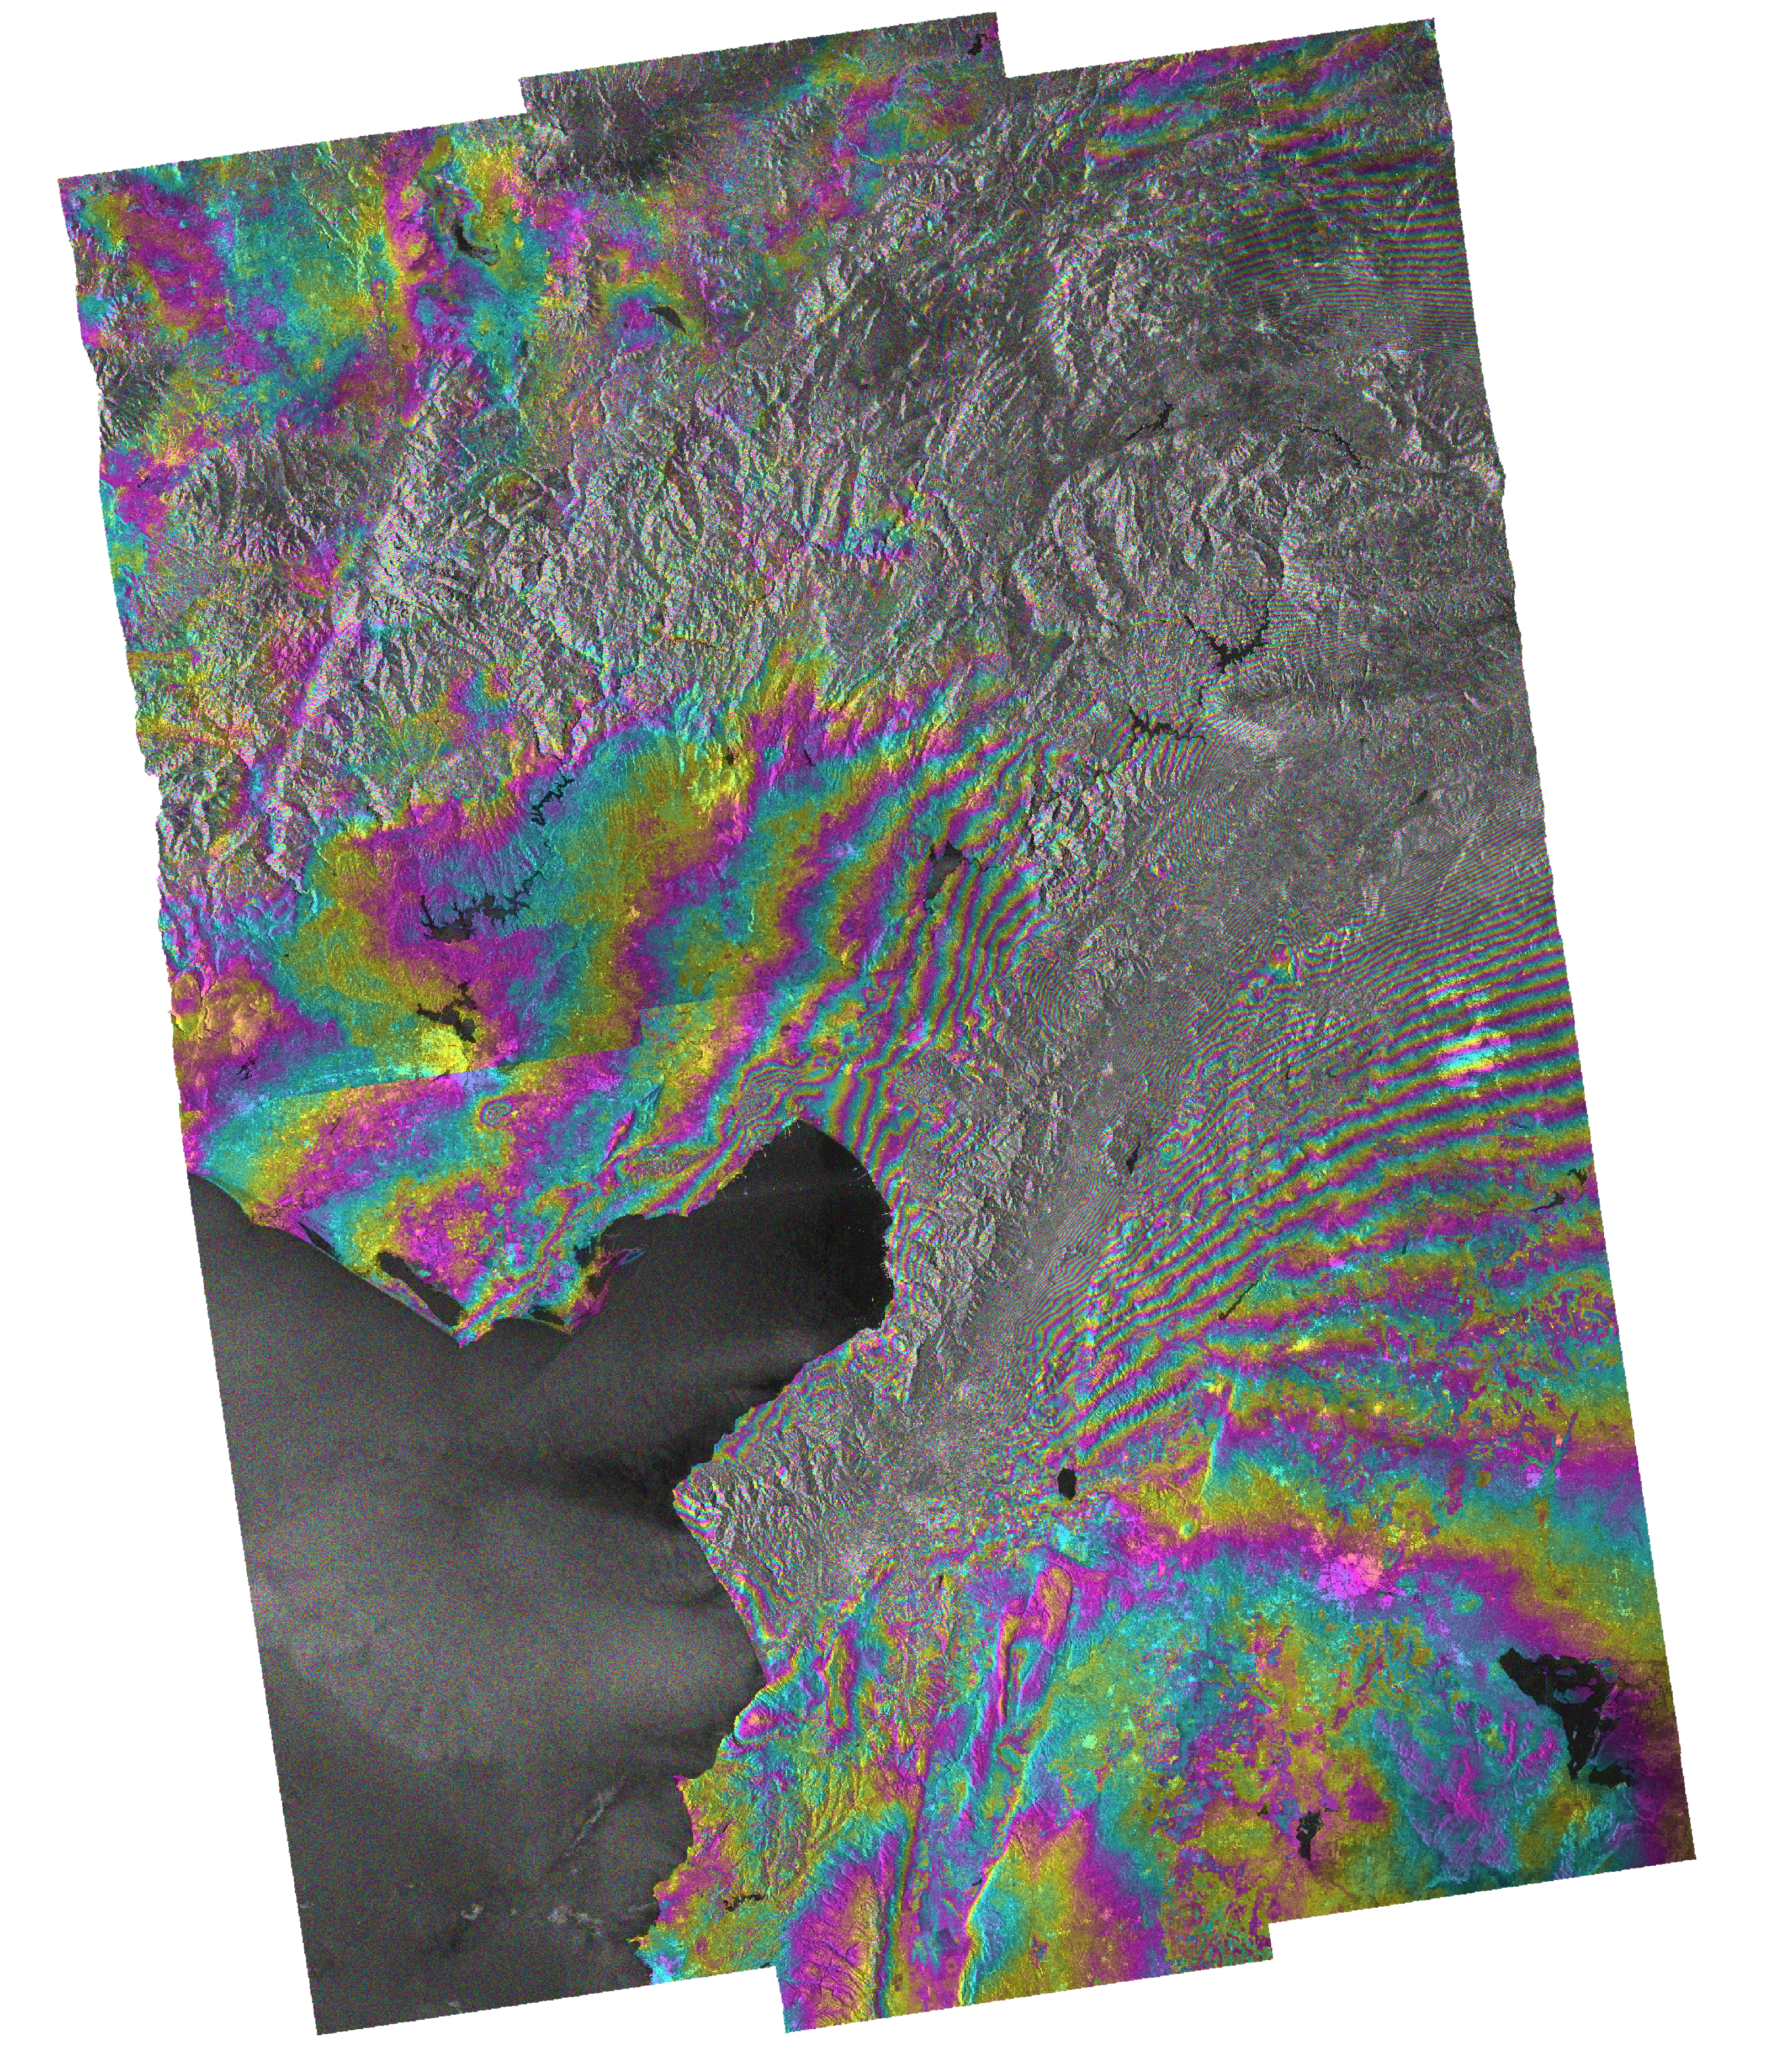
On February 6, 2023, a magnitude 7.8 earthquake struck south-central Turkey and northwestern Syria, followed by a magnitude 7.7 quake 100 km (62 miles) to the north. Nearly 9,000 people died and millions were left homeless. This Sentinel-1 wrapped interferogram displays the phase difference between two SAR acquisitions – one taken before the earthquakes occurred and one soon after. The color fringes, or color cycles, in the image represent the amount of ground surface displacement that resulted from the earthquakes.
In a wrapped interferogram, each fringe is the equivalent of one-half the SAR sensor wavelength. Since the Sentinel-1 C-band SAR sensor has a wavelength of 5.6 cm, each fringe represents 2.8 cm (1.1 in.) of ground movement.